## Diagram: Directed Graph with Three Nodes
### Overview
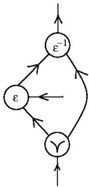
The image depicts a directed graph with three nodes connected by arrows. The nodes are labeled with symbols: **ε⁻¹** (top), **ε** (middle-left), and **Y** (bottom). Arrows indicate directional relationships between the nodes, with a bifurcation at node **Y**.
### Components/Axes
- **Nodes**:
- **ε⁻¹**: Positioned at the top, connected to **ε** via a leftward arrow.
- **ε**: Located in the middle-left, connected to **Y** via a rightward arrow.
- **Y**: Positioned at the bottom, with a split arrow (bifurcation) pointing downward.
- **Arrows**:
- **ε⁻¹ → ε**: Leftward arrow.
- **ε → Y**: Rightward arrow.
- **Y**: Split arrow (no explicit label for the bifurcation paths).
### Detailed Analysis
- **Node Labels**:
- **ε⁻¹**: Likely represents an inverse element (mathematical or symbolic context).
- **ε**: A central node, possibly denoting a base or reference state.
- **Y**: A terminal node with a bifurcation, suggesting divergence into two paths.
- **Flow Direction**:
- The graph starts at **ε⁻¹**, flows to **ε**, then to **Y**, where it splits.
- No numerical values or scales are present; the diagram is purely structural.
### Key Observations
1. **Directional Flow**: The graph enforces a strict sequence: **ε⁻¹ → ε → Y**, with no feedback loops.
2. **Bifurcation at Y**: The split arrow at **Y** implies two possible outcomes or states post-**Y**, though the paths are unlabeled.
3. **Symbolic Labels**: The use of **ε** and **ε⁻¹** suggests a mathematical or abstract system (e.g., group theory, logic).
### Interpretation
This diagram likely models a process or system with a defined sequence leading to a decision point (**Y**). The inverse relationship between **ε⁻¹** and **ε** could imply a reversible or complementary interaction (e.g., input-output dynamics, cause-effect chains). The bifurcation at **Y** introduces ambiguity, requiring further context to interpret the downstream paths. The absence of numerical data or labels on the split paths limits quantitative analysis, emphasizing the diagram’s role in illustrating structural relationships rather than quantitative trends.