\n
## Bar Chart: Accuracy on I_t vs. Average Image Size Interval
### Overview
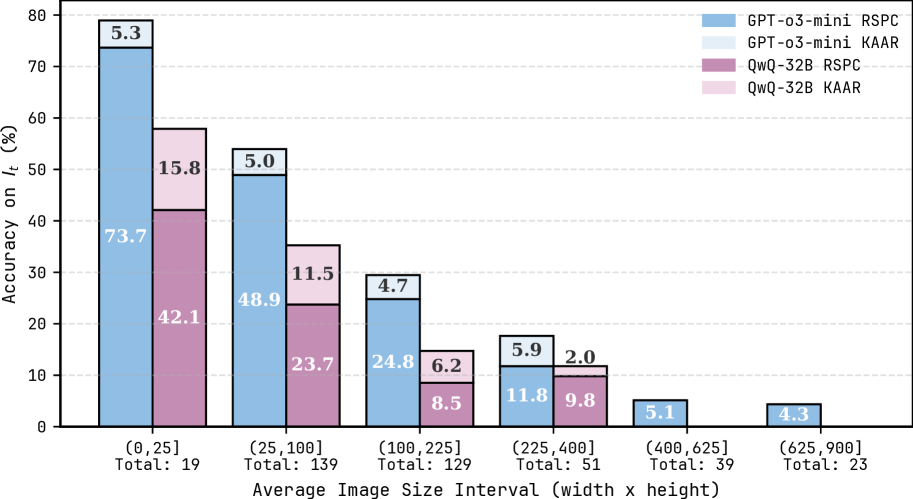
This bar chart compares the accuracy on I_t (in percentage) for two models, GPT-o3-mini and QwQ-32B, using two different methods, RSPC and KAAR, across varying average image size intervals (width x height). The chart consists of grouped bar plots for each image size interval, with each group representing the accuracy of the four combinations of model and method. The total number of images used for each interval is also indicated.
### Components/Axes
* **X-axis:** Average Image Size Interval (width x height). The intervals are: (0, 25], (25, 100], (100, 225], (225, 400], (400, 625], (625, 900].
* **Y-axis:** Accuracy on I_t (%). The scale ranges from 0 to 80.
* **Legend:**
* Blue: GPT-o3-mini RSPC
* Light Blue: GPT-o3-mini KAAR
* Orange: QwQ-32B RSPC
* Pink: QwQ-32B KAAR
* **Total Count:** Below each interval on the x-axis, the total number of images used for that interval is displayed.
### Detailed Analysis
The chart presents six groups of bars, one for each image size interval. Within each group, there are four bars representing the accuracy of each model/method combination.
* **(0, 25]**:
* GPT-o3-mini RSPC: Approximately 73.7%
* GPT-o3-mini KAAR: Approximately 42.1%
* QwQ-32B RSPC: Approximately 15.8%
* QwQ-32B KAAR: Approximately 5.3%
* Total: 19
* **(25, 100]**:
* GPT-o3-mini RSPC: Approximately 48.9%
* GPT-o3-mini KAAR: Approximately 23.7%
* QwQ-32B RSPC: Approximately 11.5%
* QwQ-32B KAAR: Approximately 5.0%
* Total: 139
* **(100, 225]**:
* GPT-o3-mini RSPC: Approximately 24.8%
* GPT-o3-mini KAAR: Approximately 8.5%
* QwQ-32B RSPC: Approximately 4.7%
* QwQ-32B KAAR: Approximately 6.2%
* Total: 129
* **(225, 400]**:
* GPT-o3-mini RSPC: Approximately 5.9%
* GPT-o3-mini KAAR: Approximately 11.8%
* QwQ-32B RSPC: Approximately 2.0%
* QwQ-32B KAAR: Approximately 9.8%
* Total: 51
* **(400, 625]**:
* GPT-o3-mini RSPC: Approximately 5.1%
* GPT-o3-mini KAAR: Not visible, but likely low.
* QwQ-32B RSPC: Not visible, but likely low.
* QwQ-32B KAAR: Approximately 4.3%
* Total: 39
* **(625, 900]**:
* GPT-o3-mini RSPC: Not visible, but likely low.
* GPT-o3-mini KAAR: Not visible, but likely low.
* QwQ-32B RSPC: Not visible, but likely low.
* QwQ-32B KAAR: Approximately 4.3%
* Total: 23
**Trends:**
* For both models, the accuracy of RSPC generally decreases as the image size interval increases.
* GPT-o3-mini consistently outperforms QwQ-32B, especially in the smaller image size intervals.
* The difference in accuracy between RSPC and KAAR methods varies depending on the image size interval.
### Key Observations
* GPT-o3-mini RSPC achieves the highest accuracy (73.7%) in the smallest image size interval ((0, 25]).
* As image size increases, the accuracy of all methods declines.
* The number of images used for each interval varies significantly, with the largest number (139) in the (25, 100] interval.
* The accuracy values for the larger image size intervals (400, 625] and (625, 900]) are very low and difficult to discern precisely from the chart.
### Interpretation
The data suggests that both GPT-o3-mini and QwQ-32B models perform better on smaller images. The RSPC method generally yields higher accuracy than the KAAR method, particularly for GPT-o3-mini. The significant drop in accuracy as image size increases indicates that the models may struggle with larger, more complex images. The varying number of images used for each interval could introduce bias in the results. The chart demonstrates a trade-off between image size and accuracy, and highlights the importance of considering image size when selecting a model and method for a given task. The consistent outperformance of GPT-o3-mini suggests it may be a more robust choice for this particular application, especially when dealing with smaller images. The low accuracy values in the larger image size intervals warrant further investigation to understand the underlying causes and potential mitigation strategies.