TECHNICAL ASSET FINGERPRINT
4ddfae412bf5aa2e79bac523
Click to view fullscreen
Press ESC or click to close
FOUND IN PAPERS
EXPERT: healer-alpha-free VERSION 1
RUNTIME: free/openrouter/healer-alpha
INTEL_VERIFIED
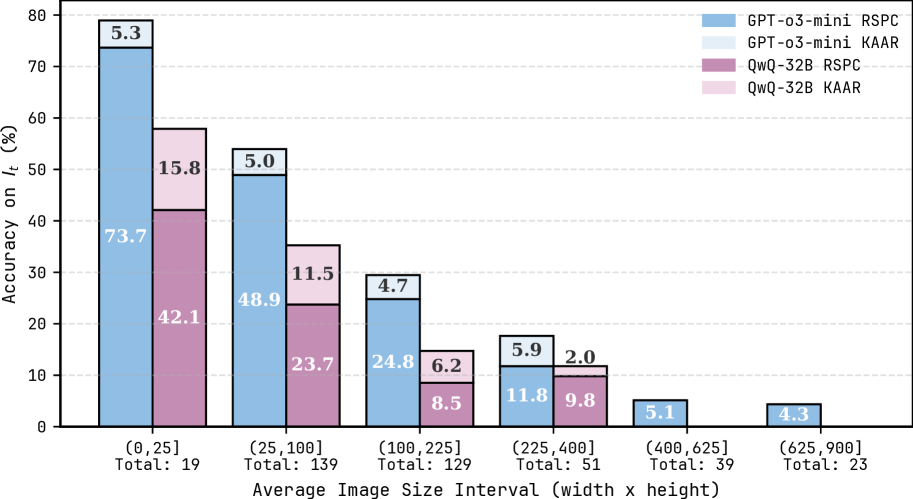
## Grouped Bar Chart: Model Accuracy on $I_t$ by Average Image Size Interval
### Overview
This is a grouped bar chart comparing the performance of two AI models (GPT-o3-mini and QwQ-32B) on a metric called "Accuracy on $I_t$ (%)" across six different intervals of average image size. Each model is evaluated using two distinct methods or metrics, labeled "RSPC" and "KAAR". The chart includes error bars on each bar, indicating uncertainty or variance in the measurements.
### Components/Axes
* **Chart Type:** Grouped bar chart with error bars.
* **Y-Axis:**
* **Label:** "Accuracy on $I_t$ (%)"
* **Scale:** Linear, ranging from 0 to 80, with major tick marks every 10 units.
* **X-Axis:**
* **Label:** "Average Image Size Interval (width x height)"
* **Categories (Intervals):** Six discrete bins representing ranges of average image size (presumably in pixels, width x height).
1. `(0,25]` - Total: 19
2. `(25,100]` - Total: 139
3. `(100,225]` - Total: 129
4. `(225,400]` - Total: 51
5. `(400,625]` - Total: 39
6. `(625,900]` - Total: 23
* The "Total" below each interval indicates the sample size (number of images) within that bin.
* **Legend (Top-Right Corner):** Maps colors to model-method combinations.
* **Light Blue:** GPT-o3-mini RSPC
* **Light Gray:** GPT-o3-mini KAAR
* **Dark Purple/Mauve:** QwQ-32B RSPC
* **Light Pink/Lavender:** QwQ-32B KAAR
* **Data Series:** Four series, represented by bars of different colors for each x-axis interval. Each bar has a black error bar extending from its top.
### Detailed Analysis
The chart displays accuracy values (with approximate error margins) for each model-method pair across the six image size intervals. The trend is a clear decrease in accuracy for all series as the average image size increases.
**Interval 1: (0,25] (Total: 19)**
* **GPT-o3-mini RSPC (Light Blue):** Accuracy = 73.7%. Error bar extends approximately ±5.3% (labeled "5.3" above the bar).
* **QwQ-32B RSPC (Dark Purple):** Accuracy = 42.1%. Error bar extends approximately ±15.8% (labeled "15.8" above the bar).
* **GPT-o3-mini KAAR (Light Gray):** Not visibly plotted for this interval.
* **QwQ-32B KAAR (Light Pink):** Not visibly plotted for this interval.
**Interval 2: (25,100] (Total: 139)**
* **GPT-o3-mini RSPC (Light Blue):** Accuracy = 48.9%. Error bar extends approximately ±5.0% (labeled "5.0").
* **QwQ-32B RSPC (Dark Purple):** Accuracy = 23.7%. Error bar extends approximately ±11.5% (labeled "11.5").
* **GPT-o3-mini KAAR (Light Gray):** Not visibly plotted.
* **QwQ-32B KAAR (Light Pink):** Not visibly plotted.
**Interval 3: (100,225] (Total: 129)**
* **GPT-o3-mini RSPC (Light Blue):** Accuracy = 24.8%. Error bar extends approximately ±4.7% (labeled "4.7").
* **QwQ-32B RSPC (Dark Purple):** Accuracy = 8.5%. Error bar extends approximately ±6.2% (labeled "6.2").
* **GPT-o3-mini KAAR (Light Gray):** Not visibly plotted.
* **QwQ-32B KAAR (Light Pink):** Not visibly plotted.
**Interval 4: (225,400] (Total: 51)**
* **GPT-o3-mini RSPC (Light Blue):** Accuracy = 11.8%. Error bar extends approximately ±5.9% (labeled "5.9").
* **QwQ-32B RSPC (Dark Purple):** Accuracy = 9.8%. Error bar extends approximately ±2.0% (labeled "2.0").
* **GPT-o3-mini KAAR (Light Gray):** Not visibly plotted.
* **QwQ-32B KAAR (Light Pink):** Not visibly plotted.
**Interval 5: (400,625] (Total: 39)**
* **GPT-o3-mini RSPC (Light Blue):** Accuracy = 5.1%. Error bar is present but the value is not labeled.
* **QwQ-32B RSPC (Dark Purple):** Not visibly plotted (or value is 0).
* **GPT-o3-mini KAAR (Light Gray):** Not visibly plotted.
* **QwQ-32B KAAR (Light Pink):** Not visibly plotted.
**Interval 6: (625,900] (Total: 23)**
* **GPT-o3-mini RSPC (Light Blue):** Accuracy = 4.3%. Error bar is present but the value is not labeled.
* **QwQ-32B RSPC (Dark Purple):** Not visibly plotted (or value is 0).
* **GPT-o3-mini KAAR (Light Gray):** Not visibly plotted.
* **QwQ-32B KAAR (Light Pink):** Not visibly plotted.
**Note on KAAR Metrics:** The "KAAR" variants for both models (light gray and light pink bars) are not visible in any of the intervals shown. This could mean their values are zero, negligible, or not measured for these intervals.
### Key Observations
1. **Strong Negative Correlation:** There is a consistent and steep downward trend in accuracy for the visible "RSPC" metric as the average image size increases. Performance drops from a high of 73.7% for the smallest images to near zero for the largest.
2. **Model Performance Gap:** GPT-o3-mini (light blue bars) consistently outperforms QwQ-32B (dark purple bars) on the RSPC metric across all intervals where both are plotted. The gap is largest for the smallest images (31.6 percentage points) and narrows as accuracy converges toward zero for larger images.
3. **Sample Size Distribution:** The majority of images fall into the middle intervals: `(25,100]` (139 images) and `(100,225]` (129 images). The smallest and largest size intervals have significantly fewer samples (19 and 23, respectively), which may affect the reliability of the accuracy estimates in those bins, as suggested by the larger error bars (e.g., ±15.8% for QwQ-32B in the first interval).
4. **Error Bar Variability:** The uncertainty (error bar size) varies. It is notably large for QwQ-32B in the first interval and for GPT-o3-mini in the fourth interval. The error bars for GPT-o3-mini in the first three intervals are relatively consistent (±4.7% to ±5.3%).
### Interpretation
This chart demonstrates a clear challenge for the evaluated models: their ability to perform the task measured by "$I_t$" degrades significantly as the input images become larger (in terms of average pixel dimensions). The "RSPC" metric shows this relationship starkly.
The data suggests that **GPT-o3-mini has a substantial performance advantage over QwQ-32B** on this specific task, particularly for smaller images. However, this advantage diminishes in absolute terms as the task becomes harder for both models with larger images. The absence of visible "KAAR" metric data is a critical finding—it implies that either this evaluation method was not applicable, failed completely, or yielded results too low to be displayed on this scale for the given image size ranges.
The decreasing sample size at the extremes (very small and very large images) is a common pattern in real-world datasets but warrants caution when interpreting the results for those bins. The large error bar for QwQ-32B on the smallest images indicates high variance in its performance on that subset, meaning its average score of 42.1% may not be highly reliable.
**In summary, the key takeaway is that image size is a major factor negatively impacting model accuracy on this task, and there is a pronounced performance hierarchy between the two models tested, with GPT-o3-mini being superior under the RSPC evaluation.**
DECODING INTELLIGENCE...