## Diagram: Visual Inference Analysis
### Overview
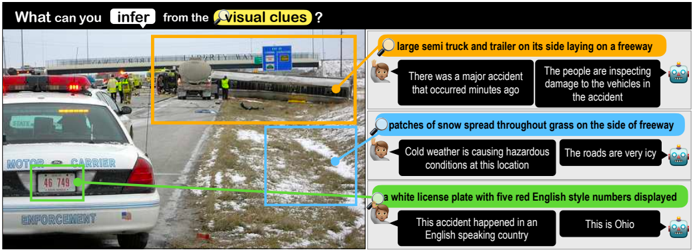
The image is a composite educational graphic designed to demonstrate the process of visual reasoning. It consists of a photograph of a traffic accident scene on the left, which is annotated with three color-coded regions (orange, blue, and green). On the right, there are three corresponding rows of text blocks that provide "inferences" based on the visual clues identified in the photograph. The graphic contrasts general human-like observations with specific, data-driven inferences often associated with AI or machine learning analysis.
### Components/Axes
The image is divided into two primary sections:
**1. The Visual Evidence (Left Side):**
* **Orange Box (Top-Center):** Highlights an overturned semi-truck and trailer on a freeway.
* **Blue Box (Center-Right):** Highlights patches of snow on the grass adjacent to the freeway.
* **Green Box (Bottom-Left):** Highlights the rear license plate of a "MOTOR CARRIER ENFORCEMENT" police vehicle. The plate reads "46 749".
**2. The Inference Blocks (Right Side):**
* **Structure:** Three rows, each containing:
* A colored header (matching the box color in the photo) describing the visual clue.
* A "Human" icon (left) with a black text box containing a general inference.
* A "Robot" icon (right) with a black text box containing a specific, data-driven inference.
### Detailed Analysis
| Region | Visual Clue Description | Human Inference | Robot/AI Inference |
| :--- | :--- | :--- | :--- |
| **Orange** | "large semi truck and trailer on its side laying on a freeway" | "There was a major accident that occurred minutes ago" | "The people are inspecting damage to the vehicles in the accident" |
| **Blue** | "patches of snow spread throughout grass on the side of freeway" | "Cold weather is causing hazardous conditions at this location" | "The roads are very icy" |
| **Green** | "a white license plate with five red English style numbers displayed" | "This accident happened in an English speaking country" | "This is Ohio" |
### Key Observations
* **Spatial Grounding:** The image uses color-coded lines to connect the specific visual evidence to the corresponding inference blocks.
* **Orange:** Connects the overturned truck to the accident-related inferences.
* **Blue:** Connects the snowy grass to the weather-related inferences.
* **Green:** Connects the license plate to the location-related inferences.
* **Inference Hierarchy:** There is a clear distinction between the "Human" and "Robot" inferences. The "Human" inferences are contextual and situational (e.g., "major accident," "cold weather," "English speaking country"), whereas the "Robot" inferences are highly specific and deductive (e.g., "inspecting damage," "roads are very icy," "This is Ohio").
* **Data Extraction:** The "Robot" inference for the green region ("This is Ohio") implies that the AI has recognized the specific format or design of the license plate, which is a specific, verifiable data point, unlike the more generalized human observation.
### Interpretation
This image serves as a pedagogical tool to illustrate the difference between **observation** and **inference**.
* **The Process:** The graphic demonstrates a three-step pipeline: (1) Identify a visual feature (the "clue"), (2) Contextualize the feature (the "Human" inference), and (3) Extract specific, actionable data from the feature (the "Robot" inference).
* **Peircean Investigative Logic:** From a semiotic perspective, the image treats the photograph as a collection of "signs." The license plate is an *indexical sign*—it points directly to the location (Ohio) because of its specific design. The snow is an *indexical sign* of the weather conditions. The overturned truck is an *iconic sign* of an accident.
* **Why it matters:** This structure is often used in computer vision training or AI explainability demonstrations. It highlights that while humans are excellent at understanding the "gist" or "context" of a scene (e.g., "it's cold"), machines are often tasked with extracting specific, granular facts (e.g., "this is Ohio") from the same visual data. The image effectively bridges the gap between raw visual input and structured, logical output.