## Screenshot: Traffic Accident Analysis Interface
### Overview
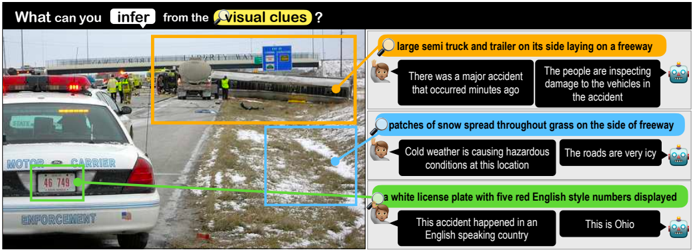
The image depicts a web-based interface analyzing a traffic accident scene. A photograph of a highway accident is annotated with color-coded text boxes, each highlighting specific visual clues and inferred conclusions. The interface appears to be part of an AI-driven system that extracts contextual information from visual data.
### Components/Axes
- **Image Elements**:
- A highway scene with a flipped semi-truck/trailer, emergency responders, and a police car.
- Annotations:
- **Yellow Box**: Highlights the overturned semi-truck and trailer.
- **Blue Box**: Marks patches of snow on the grassy roadside.
- **Green Box**: Focuses on a white license plate with red English-style numbers.
- **Text Boxes**:
- Positioned to the right of the image, each linked to a specific visual clue via arrows.
- Colors correspond to the annotated regions (yellow, blue, green).
### Detailed Analysis
1. **Yellow Text Box (Semi-Truck/Trailer)**:
- Label: "large semi truck and trailer on its side laying on a freeway"
- Inference: "There was a major accident that occurred minutes ago. The people are inspecting damage to the vehicles in the accident."
2. **Blue Text Box (Snow Patches)**:
- Label: "patches of snow spread throughout grass on the side of freeway"
- Inference: "Cold weather is causing hazardous conditions at this location. The roads are very icy."
3. **Green Text Box (License Plate)**:
- Label: "a white license plate with five red English style numbers displayed"
- Inference: "This accident happened in an English-speaking country. This is Ohio."
### Key Observations
- The interface uses color-coded annotations to link visual elements (vehicles, weather, license plates) to contextual inferences.
- The system identifies environmental factors (icy roads due to snow) and geographical context (Ohio, English-speaking country).
- No numerical data or charts are present; analysis relies on textual descriptions and spatial grounding.
### Interpretation
This interface demonstrates a system designed to infer critical details from accident scenes by analyzing visual clues. The yellow box emphasizes vehicle damage as the primary event, while the blue and green boxes contextualize the accident’s causes (weather) and location (Ohio). The absence of numerical data suggests the tool prioritizes qualitative analysis over quantitative metrics. The use of color-coding ensures clarity in associating observations with conclusions, though the system’s reliance on textual inference may lack the precision of sensor-based data.