## Chart Type: Multiple Line Charts
### Overview
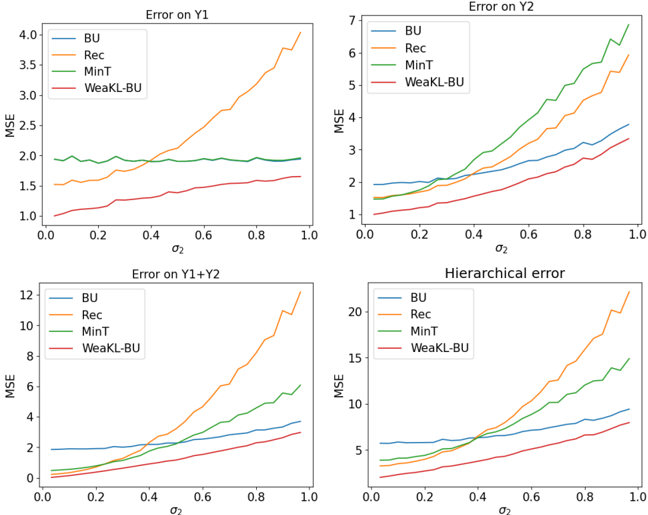
The image contains four line charts arranged in a 2x2 grid. Each chart displays the Mean Squared Error (MSE) on the y-axis against σ2 (sigma squared) on the x-axis for four different methods: BU (Bottom-Up), Rec (Reconciliation), MinT (Minimum Trace), and WeaKL-BU (Weak Kullback-Leibler Bottom-Up). The charts compare the performance of these methods on different error metrics: Error on Y1, Error on Y2, Error on Y1+Y2, and Hierarchical error.
### Components/Axes
* **X-axis (all charts):** σ2 (sigma squared), ranging from 0.0 to 1.0 in increments of 0.2.
* **Y-axis (all charts):** MSE (Mean Squared Error). The range varies for each chart.
* Error on Y1: 1.0 to 4.0
* Error on Y2: 1 to 7
* Error on Y1+Y2: 0 to 12
* Hierarchical error: 0 to 20
* **Legend (present in all charts):** Located in the top-left corner of each chart.
* Blue: BU
* Orange: Rec
* Green: MinT
* Red: WeaKL-BU
### Detailed Analysis
**1. Error on Y1**
* **BU (Blue):** Relatively flat, starting around MSE = 2.0 and remaining approximately constant.
* **Rec (Orange):** Starts around MSE = 1.6 and gradually increases to approximately 2.0.
* **MinT (Green):** Starts around MSE = 2.0 and remains relatively constant.
* **WeaKL-BU (Red):** Starts around MSE = 1.1 and gradually increases to approximately 1.6.
**2. Error on Y2**
* **BU (Blue):** Starts around MSE = 1.5 and increases to approximately 3.2.
* **Rec (Orange):** Starts around MSE = 1.7 and increases to approximately 4.0.
* **MinT (Green):** Starts around MSE = 1.0 and increases sharply to approximately 6.0.
* **WeaKL-BU (Red):** Starts around MSE = 1.0 and increases to approximately 2.0.
**3. Error on Y1+Y2**
* **BU (Blue):** Starts around MSE = 1.5 and increases to approximately 3.5.
* **Rec (Orange):** Starts around MSE = 1.5 and increases sharply to approximately 12.0.
* **MinT (Green):** Starts around MSE = 1.5 and increases to approximately 5.0.
* **WeaKL-BU (Red):** Starts around MSE = 0.5 and increases to approximately 2.5.
**4. Hierarchical error**
* **BU (Blue):** Starts around MSE = 3.0 and increases to approximately 7.0.
* **Rec (Orange):** Starts around MSE = 3.0 and increases sharply to approximately 22.0.
* **MinT (Green):** Starts around MSE = 3.0 and increases to approximately 15.0.
* **WeaKL-BU (Red):** Starts around MSE = 1.0 and increases to approximately 8.0.
### Key Observations
* The 'Rec' method (Orange) consistently shows the highest MSE for 'Error on Y1+Y2' and 'Hierarchical error' as σ2 increases.
* The 'WeaKL-BU' method (Red) generally exhibits the lowest MSE across all charts, especially at lower σ2 values.
* For 'Error on Y1', all methods show relatively stable MSE values across the range of σ2.
* For 'Error on Y2', all methods show an increasing MSE as σ2 increases, with 'MinT' (Green) showing the steepest increase.
### Interpretation
The charts compare the performance of four different time series forecasting methods (BU, Rec, MinT, and WeaKL-BU) under varying levels of uncertainty (represented by σ2). The MSE is used as the error metric.
The results suggest that the 'WeaKL-BU' method is generally more robust to increasing uncertainty, as it consistently exhibits lower MSE values compared to the other methods, especially at higher σ2 values. The 'Rec' method appears to be the most sensitive to increasing uncertainty, showing a significant increase in MSE for 'Error on Y1+Y2' and 'Hierarchical error'. The 'BU' and 'MinT' methods show intermediate performance, with 'MinT' showing a steeper increase in MSE for 'Error on Y2' and 'Hierarchical error' compared to 'BU'.
The differences in performance across the different error metrics (Y1, Y2, Y1+Y2, Hierarchical error) indicate that the choice of forecasting method may depend on the specific error metric being optimized. For example, if the goal is to minimize the error on Y1, all methods perform relatively similarly. However, if the goal is to minimize the hierarchical error, the 'WeaKL-BU' method appears to be the best choice.