TECHNICAL ASSET FINGERPRINT
4df22cca2a4681f69bd56355
Click to view fullscreen
Press ESC or click to close
FOUND IN PAPERS
EXPERT: healer-alpha-free VERSION 1
RUNTIME: free/openrouter/healer-alpha
INTEL_VERIFIED
## Line Charts: Error Metrics vs. Sigma₂ (σ₂)
### Overview
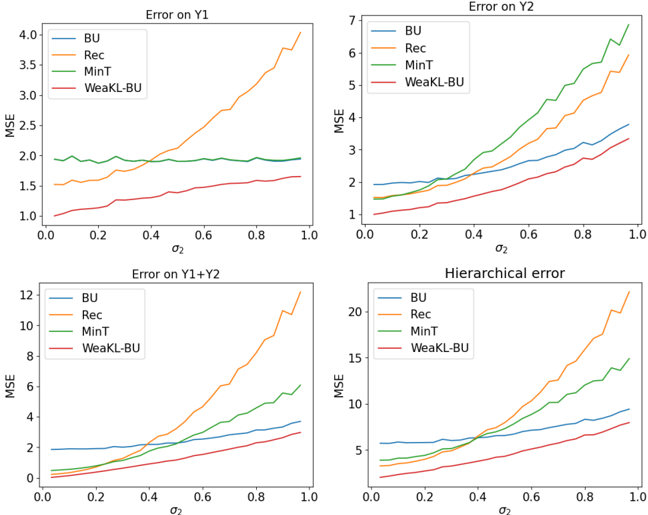
The image contains four line charts arranged in a 2x2 grid. Each chart plots the Mean Squared Error (MSE) on the y-axis against a parameter σ₂ (sigma subscript 2) on the x-axis, ranging from 0.0 to 1.0. The charts compare the performance of four different methods: BU, Rec, MinT, and WeakKL-BU. The titles indicate the error is measured on different targets: Y1, Y2, Y1+Y2, and a "Hierarchical error."
### Components/Axes
* **Common X-Axis:** Labeled "σ₂". Scale is linear from 0.0 to 1.0, with major ticks at 0.0, 0.2, 0.4, 0.6, 0.8, 1.0.
* **Common Y-Axis:** Labeled "MSE". The scale varies per chart.
* **Legend:** Present in the top-left corner of each subplot. It maps colors to method names:
* Blue line: **BU**
* Orange line: **Rec**
* Green line: **MinT**
* Red line: **WeakKL-BU**
* **Chart Titles:**
* Top-Left: "Error on Y1"
* Top-Right: "Error on Y2"
* Bottom-Left: "Error on Y1+Y2"
* Bottom-Right: "Hierarchical error"
### Detailed Analysis
**1. Chart: Error on Y1 (Top-Left)**
* **Y-Axis Scale:** 0.0 to 4.0.
* **Trends & Approximate Values:**
* **BU (Blue):** Starts at ~1.9. Shows a very slight, almost flat increase, ending at ~2.0. Trend is nearly constant.
* **Rec (Orange):** Starts at ~1.5. Shows a strong, steady upward trend, accelerating slightly after σ₂=0.6. Ends at the highest point, ~4.0.
* **MinT (Green):** Starts at ~2.0. Fluctuates slightly but remains essentially flat across the entire range, ending at ~2.0.
* **WeakKL-BU (Red):** Starts at the lowest point, ~1.0. Shows a steady, moderate upward trend. Ends at ~1.7.
* **Order at σ₂=1.0 (Highest to Lowest):** Rec (~4.0) > MinT (~2.0) ≈ BU (~2.0) > WeakKL-BU (~1.7).
**2. Chart: Error on Y2 (Top-Right)**
* **Y-Axis Scale:** 1 to 7.
* **Trends & Approximate Values:**
* **BU (Blue):** Starts at ~1.9. Shows a steady, moderate upward trend. Ends at ~3.8.
* **Rec (Orange):** Starts at ~1.5. Shows a strong, steady upward trend. Ends at ~6.0.
* **MinT (Green):** Starts at ~1.5. Shows the steepest upward trend of all lines in this chart. Ends at the highest point, ~6.8.
* **WeakKL-BU (Red):** Starts at the lowest point, ~1.1. Shows a steady, moderate upward trend. Ends at ~3.3.
* **Key Observation:** The MinT line crosses above the Rec line around σ₂=0.7, becoming the worst performer for higher σ₂ values.
* **Order at σ₂=1.0 (Highest to Lowest):** MinT (~6.8) > Rec (~6.0) > BU (~3.8) > WeakKL-BU (~3.3).
**3. Chart: Error on Y1+Y2 (Bottom-Left)**
* **Y-Axis Scale:** 0 to 12.
* **Trends & Approximate Values:**
* **BU (Blue):** Starts at ~2.0. Shows a steady, moderate upward trend. Ends at ~3.8.
* **Rec (Orange):** Starts near 0. Shows a very strong, accelerating upward trend. Ends at the highest point, ~12.0.
* **MinT (Green):** Starts near 0. Shows a strong upward trend, but less steep than Rec. Ends at ~6.0.
* **WeakKL-BU (Red):** Starts at the lowest point, ~0.2. Shows a steady, moderate upward trend. Ends at ~3.0.
* **Order at σ₂=1.0 (Highest to Lowest):** Rec (~12.0) > MinT (~6.0) > BU (~3.8) > WeakKL-BU (~3.0).
**4. Chart: Hierarchical Error (Bottom-Right)**
* **Y-Axis Scale:** 0 to 20.
* **Trends & Approximate Values:**
* **BU (Blue):** Starts at ~5.8. Shows a steady, moderate upward trend. Ends at ~9.5.
* **Rec (Orange):** Starts at ~3.0. Shows a very strong, accelerating upward trend. Ends at the highest point, ~22.0.
* **MinT (Green):** Starts at ~3.5. Shows a strong upward trend. Ends at ~14.5.
* **WeakKL-BU (Red):** Starts at the lowest point, ~2.0. Shows a steady, moderate upward trend. Ends at ~7.8.
* **Order at σ₂=1.0 (Highest to Lowest):** Rec (~22.0) > MinT (~14.5) > BU (~9.5) > WeakKL-BU (~7.8).
### Key Observations
1. **Consistent Hierarchy:** Across all four error metrics, the **WeakKL-BU (Red)** method consistently has the lowest MSE at σ₂=0 and maintains the lowest or near-lowest error as σ₂ increases. The **Rec (Orange)** method consistently shows the most dramatic increase in error with σ₂, often becoming the worst performer.
2. **Divergent Behavior of MinT:** The **MinT (Green)** method shows highly variable relative performance. It is flat and stable for "Error on Y1", but exhibits the steepest increase for "Error on Y2", even surpassing Rec. This suggests its performance is highly sensitive to the specific target variable.
3. **Monotonic Increase:** For all methods and all charts, MSE is a non-decreasing function of σ₂. There are no instances where error decreases as σ₂ increases.
4. **Scale of Error:** The magnitude of MSE varies greatly between charts. "Error on Y1+Y2" and "Hierarchical error" reach much higher absolute values (up to 12 and 22, respectively) compared to errors on individual variables Y1 (max ~4) and Y2 (max ~7).
### Interpretation
The data demonstrates a clear comparative analysis of four estimation or forecasting methods under increasing levels of a noise or variance parameter (σ₂).
* **Method Robustness:** **WeakKL-BU** appears to be the most robust method, as its error grows the slowest with increasing σ₂ across all metrics. This suggests it is least affected by the condition represented by σ₂.
* **Method Sensitivity:** **Rec** is the most sensitive to σ₂, with error growing rapidly. This indicates it may be overfitting or poorly regularized for conditions with higher σ₂. **MinT** shows a critical weakness specifically related to the Y2 variable, where its performance degrades catastrophically.
* **Error Composition:** The "Error on Y1+Y2" chart likely represents a sum or combined metric. The fact that Rec's error here (~12) is roughly the sum of its errors on Y1 (~4) and Y2 (~6) suggests the errors are additive. The "Hierarchical error" has a different scale and structure, implying it is a distinct, possibly more complex, aggregate metric.
* **Practical Implication:** If σ₂ represents a real-world parameter like measurement noise or model uncertainty, a practitioner would choose **WeakKL-BU** for stable performance. They would avoid **Rec** in high-σ₂ environments and be cautious with **MinT** if the Y2 variable is important. The charts provide a quantitative basis for method selection based on the expected operating conditions (value of σ₂) and the priority of different error targets (Y1, Y2, or combined).
DECODING INTELLIGENCE...