## Scatter Plot Series: Five Datasets
### Overview
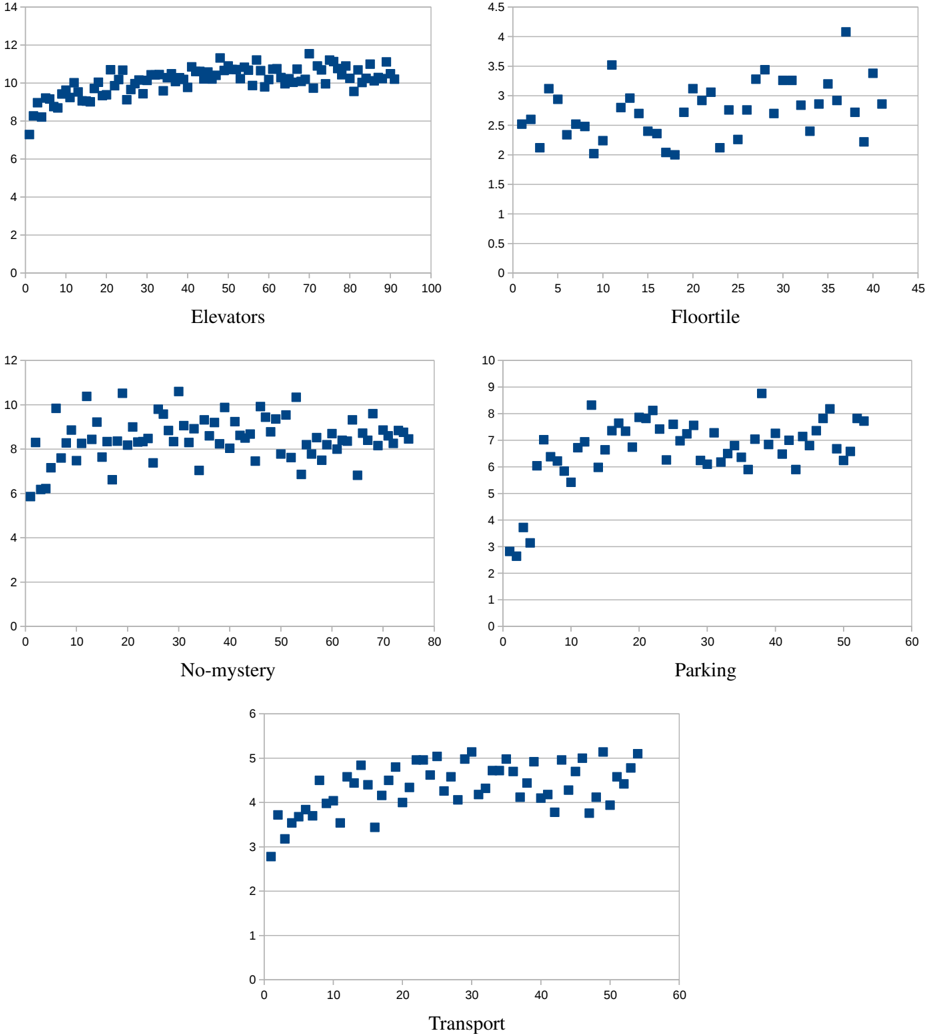
The image displays five separate scatter plots arranged in a grid (two rows of two, with a fifth plot centered below). Each plot visualizes a different dataset, identified by a title below the x-axis. All plots use identical blue square markers for data points. The plots lack explicit axis titles (e.g., "Time," "Value") and units, limiting full contextual interpretation. The data appears to show relationships between two numerical variables for each category.
### Components/Axes
**Common Elements:**
* **Chart Type:** Scatter plot.
* **Marker:** Solid blue squares.
* **Grid:** Light gray horizontal grid lines are present on all plots.
* **Titles:** Each plot has a title centered below its x-axis: "Elevators", "Floortile", "No-mystery", "Parking", "Transport".
* **Axes:** All axes are numerical with labeled tick marks. No units or descriptive labels are provided for any axis.
**Individual Plot Axes:**
1. **Elevators (Top-Left):**
* X-axis: 0 to 100, increments of 10.
* Y-axis: 0 to 14, increments of 2.
2. **Floortile (Top-Right):**
* X-axis: 0 to 45, increments of 5.
* Y-axis: 0 to 4.5, increments of 0.5.
3. **No-mystery (Middle-Left):**
* X-axis: 0 to 80, increments of 10.
* Y-axis: 0 to 12, increments of 2.
4. **Parking (Middle-Right):**
* X-axis: 0 to 60, increments of 10.
* Y-axis: 0 to 10, increments of 1.
5. **Transport (Bottom-Center):**
* X-axis: 0 to 60, increments of 10.
* Y-axis: 0 to 6, increments of 1.
### Detailed Analysis
**1. Elevators:**
* **Trend:** The data shows a clear, strong positive correlation. The cloud of points slopes upward from left to right.
* **Data Distribution:** Points are densely clustered. At X≈0, Y values range approximately from 7 to 9. As X increases to 100, Y values rise and concentrate between approximately 10 and 12. The relationship appears roughly linear with a slight plateau at higher X values.
**2. Floortile:**
* **Trend:** The data shows a very weak or no clear linear trend. The points are widely scattered.
* **Data Distribution:** Y-values are primarily between 2 and 4 across the entire X range (0-40). There is a slight visual suggestion of higher Y-values (up to ~4.2) in the X=35-40 region, but the overall pattern is diffuse.
**3. No-mystery:**
* **Trend:** The data shows a moderate positive correlation. The general cloud of points slopes upward.
* **Data Distribution:** At low X (0-10), Y values range from about 6 to 10. As X increases to 70-80, the center of the distribution shifts upward, with most points falling between Y=8 and Y=10. The spread (variance) appears consistent across the X range.
**4. Parking:**
* **Trend:** The data shows a distinct two-phase pattern. There is a sharp positive trend at very low X values, followed by a plateau with high scatter.
* **Data Distribution:** For X < 5, Y values are low (2-4). Between X=5 and X=20, there is a steep increase in Y values to the 6-8 range. For X > 20, the data scatters widely between Y=5 and Y=9, with no further clear upward trend. One notable outlier point is near (X≈35, Y≈9).
**5. Transport:**
* **Trend:** The data shows a clear positive correlation, similar to "Elevators" but on a different scale.
* **Data Distribution:** At X≈0, Y values are around 3-4. As X increases to 50-60, Y values rise and cluster between 4 and 5. The relationship appears fairly linear with moderate scatter.
### Key Observations
* **Scale Variance:** The Y-axis scales differ significantly across plots (max Y: 14, 4.5, 12, 10, 6), indicating the measured phenomena operate on different magnitudes.
* **Correlation Strength:** "Elevators" and "Transport" show the strongest, cleanest positive correlations. "No-mystery" shows a moderate correlation. "Parking" shows a non-linear (asymptotic) relationship. "Floortile" shows the weakest relationship.
* **Data Density:** The number of data points appears roughly similar across plots, estimated between 50-100 points each.
* **Missing Context:** The complete absence of axis labels and units is a major limitation. We cannot determine what is being measured (e.g., time, cost, count, efficiency) or the relationship's real-world meaning.
### Interpretation
The five scatter plots likely represent performance metrics, error rates, or resource measurements for five different systems or scenarios ("Elevators", "Floortile", etc.) as a function of an independent variable (X-axis).
* **"Elevators" and "Transport"** suggest systems where the measured output (Y) improves or increases predictably with the input variable (X). This could indicate scalability, learning curves, or direct proportional relationships.
* **"No-mystery"** shows a similar but noisier positive relationship, suggesting more variability in the system's response.
* **"Parking"** indicates a system with a rapid initial improvement that quickly hits a ceiling or saturation point, after which increasing the input (X) yields no further consistent gain in output (Y). This is characteristic of systems with capacity limits or diminishing returns.
* **"Floortile"** suggests a system where the output (Y) is largely independent of the input variable (X) within the tested range, or where other unmeasured factors dominate the outcome.
**Without axis labels, this interpretation remains speculative.** The primary informational value of the image is in the comparative visual patterns of correlation and distribution across the five titled datasets. To make this data actionable, the axes must be defined (e.g., "X: Number of Iterations, Y: Accuracy Score" or "X: Load (users), Y: Response Time (ms)").