# Technical Document Extraction: DMMath Log-Log Plot
## 1. Component Isolation
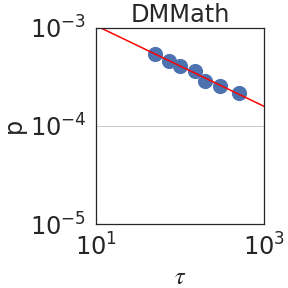
* **Header:** Contains the title "DMMath".
* **Main Chart Area:** A log-log coordinate system featuring a series of data points and a linear regression line.
* **Axes:**
* **Y-axis (Vertical):** Labeled "$p$".
* **X-axis (Horizontal):** Labeled "$\tau$".
## 2. Metadata and Labels
| Element | Value/Text |
| :--- | :--- |
| **Title** | DMMath |
| **Y-Axis Label** | $p$ |
| **X-Axis Label** | $\tau$ |
| **Y-Axis Scale** | Logarithmic ($10^{-5}$ to $10^{-3}$) |
| **X-Axis Scale** | Logarithmic ($10^{1}$ to $10^{3}$) |
## 3. Data Series Analysis
The chart is a log-log plot, which typically illustrates power-law relationships where $p \propto \tau^{-k}$.
### Trend Verification
* **Red Line:** Slopes downward from left to right. On a log-log scale, this linear trend represents a power-law decay.
* **Blue Circular Markers:** These represent discrete data points. They follow the downward trajectory of the red line closely, indicating a strong correlation and a consistent decay rate.
### Data Point Extraction (Estimated)
Based on the logarithmic grid:
* **Point 1:** $\tau \approx 5 \times 10^1$, $p \approx 5 \times 10^{-4}$
* **Point 2:** $\tau \approx 7 \times 10^1$, $p \approx 4.5 \times 10^{-4}$
* **Point 3:** $\tau \approx 1 \times 10^2$, $p \approx 4 \times 10^{-4}$
* **Point 4:** $\tau \approx 2 \times 10^2$, $p \approx 3.5 \times 10^{-4}$
* **Point 5:** $\tau \approx 3 \times 10^2$, $p \approx 3 \times 10^{-4}$
* **Point 6:** $\tau \approx 5 \times 10^2$, $p \approx 2.5 \times 10^{-4}$
* **Point 7:** $\tau \approx 8 \times 10^2$, $p \approx 2 \times 10^{-4}$
## 4. Visual Components and Flow
1. **Coordinate System:** The plot uses a square aspect ratio with major grid lines at powers of 10. A faint horizontal grid line is visible at $p = 10^{-4}$.
2. **Regression Line (Red):** The line originates near the top-left corner ($10^1, 10^{-3}$) and terminates near the bottom-right corner ($10^3, 1.5 \times 10^{-4}$).
3. **Data Points (Blue):** Seven large blue circular markers are plotted. They are clustered in the upper-right quadrant of the visible field, specifically between $\tau$ values of $5 \times 10^1$ and $8 \times 10^2$.
## 5. Summary of Information
This image represents a technical data visualization for "DMMath". It shows a clear inverse relationship between the variable $\tau$ and the variable $p$. Because the data forms a straight line on a log-log scale, it confirms that $p$ decreases as a power of $\tau$. The data points are highly consistent with the fitted red regression line, suggesting a predictable mathematical model for the DMMath dataset.