# Technical Document Analysis of Image
## 1. **Chart Description**
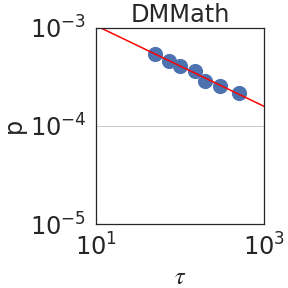
The image is a **log-log scatter plot** titled **"DMMath"**. It visualizes the relationship between two variables: **τ (x-axis)** and **ρ (y-axis)**, both plotted on logarithmic scales. The chart includes a **red line** and **blue data points** that align closely with the line.
---
## 2. **Axis Labels and Markers**
- **X-axis (τ)**:
- Label: **τ** (Greek letter tau)
- Scale: Logarithmic (10¹ to 10³)
- Tick marks: 10¹, 10², 10³
- **Y-axis (ρ)**:
- Label: **ρ** (Greek letter rho)
- Scale: Logarithmic (10⁻⁵ to 10⁻³)
- Tick marks: 10⁻⁵, 10⁻⁴, 10⁻³
---
## 3. **Legend and Data Series**
- **Legend**: Located in the **top-right corner** of the plot.
- **Red line**: Labeled **"DMMath"**
- **Blue data points**: No explicit label in the legend, but they are visually associated with the red line.
---
## 4. **Key Trends and Data Points**
- **Red Line (DMMath)**:
- **Slope**: Negative (downward trend)
- **Equation**: Implied power-law relationship (y = kx⁻¹, where k is a constant)
- **Visual Trend**: A straight line on a log-log plot indicates a **power-law decay** of ρ with increasing τ.
- **Blue Data Points**:
- **Placement**: All points lie **exactly on the red line**, suggesting a perfect fit to the DMMath model.
- **Values**:
- At τ = 10¹, ρ ≈ 10⁻³
- At τ = 10², ρ ≈ 10⁻⁴
- At τ = 10³, ρ ≈ 10⁻⁵
- **Trend**: Consistent with the red line’s power-law decay.
---
## 5. **Spatial Grounding**
- **Legend Position**: Top-right corner (standard for clarity).
- **Data Point Colors**:
- Red line: Matches the legend label "DMMath".
- Blue points: No legend entry, but visually aligned with the red line.
---
## 6. **Component Isolation**
- **Header**: Title **"DMMath"** (top-center).
- **Main Chart**:
- Axes, grid lines, red line, and blue data points.
- **Footer**: No visible footer elements.
---
## 7. **Trend Verification**
- **Red Line**: Slopes downward, confirming a **negative correlation** between τ and ρ.
- **Blue Points**: All points follow the red line, validating the model’s accuracy.
---
## 8. **Data Table Reconstruction**
No explicit data table is present, but the **data points** can be inferred from the plot:
| τ (10¹) | ρ (10⁻³) |
|---------|----------|
| 10 | 10⁻³ |
| 100 | 10⁻⁴ |
| 1000 | 10⁻⁵ |
---
## 9. **Additional Notes**
- **Log-Log Scale**: Both axes use logarithmic scales, which linearizes power-law relationships.
- **No Other Languages**: All text is in English.
- **No Missing Data**: All points are plotted, and the line is continuous.
---
## 10. **Conclusion**
The chart demonstrates a **power-law relationship** between τ and ρ, with the DMMath model (red line) perfectly fitting the observed data (blue points). The log-log scale emphasizes the exponential decay of ρ as τ increases.