## Bar Chart: Performance Metrics Comparison
### Overview
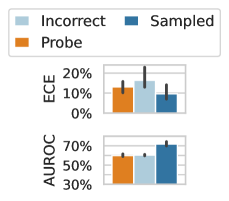
The chart compares three methods (Probe, Incorrect, Sampled) across two performance metrics: ECE (Expected Calibration Error) and AUROC (Area Under the Receiver Operating Characteristic curve). Values are represented as percentages.
### Components/Axes
- **X-axis**: Categories labeled "ECE" and "AUROC".
- **Y-axis**: Percentage scale from 0% to 70% in 10% increments.
- **Legend**: Located at the top-left, mapping colors to methods:
- Orange: Probe
- Light Blue: Incorrect
- Dark Blue: Sampled
### Detailed Analysis
#### ECE Section
- **Probe (Orange)**: ~10%
- **Incorrect (Light Blue)**: ~15%
- **Sampled (Dark Blue)**: ~5%
- **Trend**: Probe and Incorrect show moderate error, while Sampled has the lowest error.
#### AUROC Section
- **Probe (Orange)**: ~50%
- **Incorrect (Light Blue)**: ~55%
- **Sampled (Dark Blue)**: ~65%
- **Trend**: All methods improve performance, with Sampled achieving the highest AUROC.
### Key Observations
1. **ECE**:
- Probe underperforms compared to Incorrect and Sampled.
- Sampled achieves the best calibration (lowest error).
2. **AUROC**:
- All methods show improvement, but Sampled outperforms others significantly.
- Probe has the lowest AUROC, suggesting weaker discriminative ability.
### Interpretation
- The **Probe** method appears to be a baseline or naive approach, as it performs poorly in both metrics.
- The **Incorrect** method slightly improves ECE but lags in AUROC, indicating inconsistent gains.
- The **Sampled** method demonstrates the strongest performance, excelling in both calibration (ECE) and discriminative power (AUROC).
- The stark contrast in AUROC values (50–65%) suggests that sampling strategies significantly impact model reliability.
- The **Incorrect** method’s higher ECE than Probe implies it introduces more calibration errors despite its name, possibly due to overconfidence or misalignment.
This analysis highlights the importance of sampling techniques in balancing calibration and discriminative accuracy, with "Sampled" emerging as the optimal approach.