## Bar Chart: ECE and AUROC Comparison
### Overview
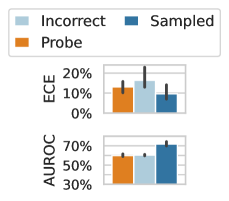
The image presents a bar chart comparing three categories: "Incorrect", "Sampled", and "Probe" across two metrics: ECE (Expected Calibration Error) and AUROC (Area Under the Receiver Operating Characteristic curve). The chart displays the mean values for each category with error bars indicating variability.
### Components/Axes
* **Y-axis (Left):**
* Top Chart: ECE, labeled vertically. Scale ranges from 0% to 20% in increments of 10%.
* Bottom Chart: AUROC, labeled vertically. Scale ranges from 30% to 70% in increments of 20%.
* **X-axis:** Implicitly represents the three categories: "Probe", "Incorrect", and "Sampled".
* **Legend (Top):** Located at the top of the image.
* Light Blue: "Incorrect"
* Dark Blue: "Sampled"
* Orange: "Probe"
### Detailed Analysis
**Top Chart: ECE**
* **Probe (Orange):** ECE value is approximately 12% with an error bar extending from about 8% to 16%.
* **Incorrect (Light Blue):** ECE value is approximately 16% with an error bar extending from about 12% to 20%.
* **Sampled (Dark Blue):** ECE value is approximately 9% with an error bar extending from about 5% to 13%.
**Bottom Chart: AUROC**
* **Probe (Orange):** AUROC value is approximately 62% with an error bar extending from about 58% to 66%.
* **Incorrect (Light Blue):** AUROC value is approximately 64% with an error bar extending from about 60% to 68%.
* **Sampled (Dark Blue):** AUROC value is approximately 71% with an error bar extending from about 67% to 75%.
### Key Observations
* For ECE, "Sampled" has the lowest value, while "Incorrect" has the highest.
* For AUROC, "Sampled" has the highest value, while "Probe" has the lowest.
* The error bars indicate the variability within each category.
### Interpretation
The chart suggests that the "Sampled" category performs best in terms of calibration (lower ECE) and discrimination (higher AUROC). The "Incorrect" category has the worst calibration (highest ECE) but performs comparably to "Sampled" in terms of discrimination (AUROC). The "Probe" category has the worst discrimination (lowest AUROC). The error bars provide an indication of the uncertainty associated with each estimate.