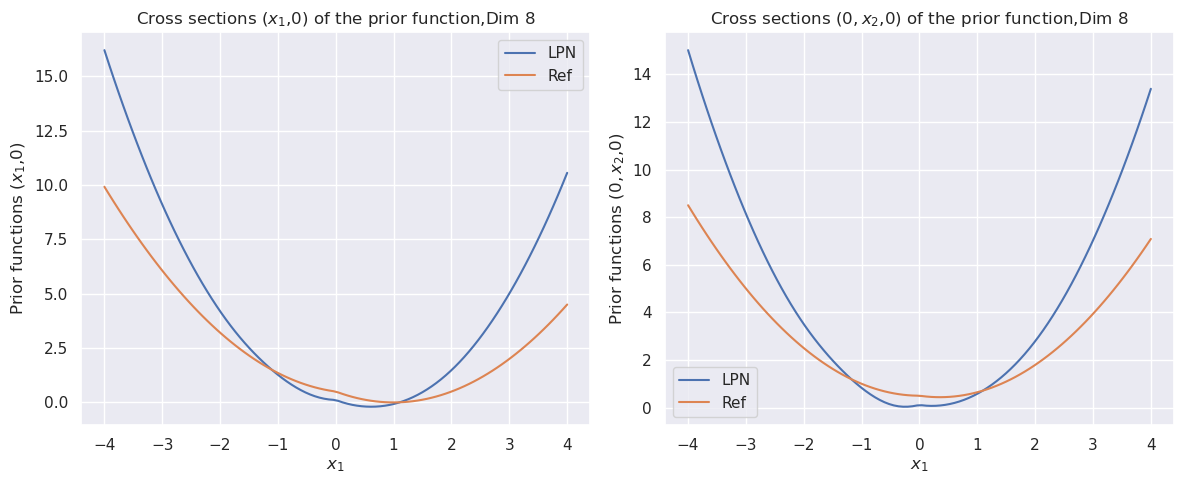
## Chart: Cross Sections of Prior Functions
### Overview
The image contains two line charts, each displaying cross-sections of prior functions. Both charts compare two methods, LPN (blue line) and Ref (orange line), across a range of x-values. The left chart shows cross-sections (x1,0), while the right chart shows cross-sections (0, x2,0). Both charts are for a prior function with dimension 8.
### Components/Axes
**Left Chart:**
* **Title:** Cross sections (x1,0) of the prior function, Dim 8
* **X-axis:** x1, ranging from -4 to 4 in increments of 1.
* **Y-axis:** Prior functions (x1,0), ranging from 0 to 15.0 in increments of 2.5.
* **Legend:** Located in the top-right corner.
* LPN: Blue line
* Ref: Orange line
**Right Chart:**
* **Title:** Cross sections (0, x2,0) of the prior function, Dim 8
* **X-axis:** x1, ranging from -4 to 4 in increments of 1.
* **Y-axis:** Prior functions (0, x2,0), ranging from 0 to 14 in increments of 2.
* **Legend:** Located in the bottom-left corner.
* LPN: Blue line
* Ref: Orange line
### Detailed Analysis
**Left Chart (Cross sections (x1,0)):**
* **LPN (Blue):** The LPN line starts at approximately 16 at x1 = -4, decreases to a minimum of approximately -0.5 near x1 = 0.5, and then increases to approximately 10 at x1 = 4.
* x1 = -4, Prior function (x1,0) ≈ 16
* x1 = -2, Prior function (x1,0) ≈ 4
* x1 = 0, Prior function (x1,0) ≈ 0
* x1 = 2, Prior function (x1,0) ≈ 4
* x1 = 4, Prior function (x1,0) ≈ 10
* **Ref (Orange):** The Ref line starts at approximately 10 at x1 = -4, decreases to a minimum of approximately 1 near x1 = 0.5, and then increases to approximately 4 at x1 = 4.
* x1 = -4, Prior function (x1,0) ≈ 10
* x1 = -2, Prior function (x1,0) ≈ 2.5
* x1 = 0, Prior function (x1,0) ≈ 1
* x1 = 2, Prior function (x1,0) ≈ 2.5
* x1 = 4, Prior function (x1,0) ≈ 4
**Right Chart (Cross sections (0, x2,0)):**
* **LPN (Blue):** The LPN line starts at approximately 15 at x1 = -4, decreases to a minimum of approximately -0.5 near x1 = 0.5, and then increases to approximately 13 at x1 = 4.
* x1 = -4, Prior function (0, x2,0) ≈ 15
* x1 = -2, Prior function (0, x2,0) ≈ 3
* x1 = 0, Prior function (0, x2,0) ≈ 0
* x1 = 2, Prior function (0, x2,0) ≈ 3
* x1 = 4, Prior function (0, x2,0) ≈ 13
* **Ref (Orange):** The Ref line starts at approximately 8.5 at x1 = -4, decreases to a minimum of approximately 0.5 near x1 = 0.5, and then increases to approximately 7 at x1 = 4.
* x1 = -4, Prior function (0, x2,0) ≈ 8.5
* x1 = -2, Prior function (0, x2,0) ≈ 1.5
* x1 = 0, Prior function (0, x2,0) ≈ 0.5
* x1 = 2, Prior function (0, x2,0) ≈ 1.5
* x1 = 4, Prior function (0, x2,0) ≈ 7
### Key Observations
* Both charts show a similar U-shaped trend for both LPN and Ref, indicating a quadratic-like relationship between x1 and the prior functions.
* In both charts, the LPN line generally has higher values than the Ref line, especially at the extreme values of x1.
* The minimum values for both LPN and Ref occur near x1 = 0.5 in both charts.
### Interpretation
The charts compare the cross-sections of prior functions generated by two different methods, LPN and Ref. The U-shaped curves suggest that as x1 moves away from the center (around 0.5) in either direction, the prior function values increase. The LPN method tends to produce higher prior function values compared to the Ref method, particularly at the extremes of the x1 range. This could indicate that LPN assigns higher probabilities to extreme values compared to Ref, or that LPN has a wider spread. The fact that both charts show similar trends suggests that the underlying function has similar characteristics along both (x1,0) and (0, x2,0) cross-sections. The dimension of the prior function is 8, which implies that these are just two slices of a higher-dimensional function.