\n
## Charts: Cross Sections of Prior Functions
### Overview
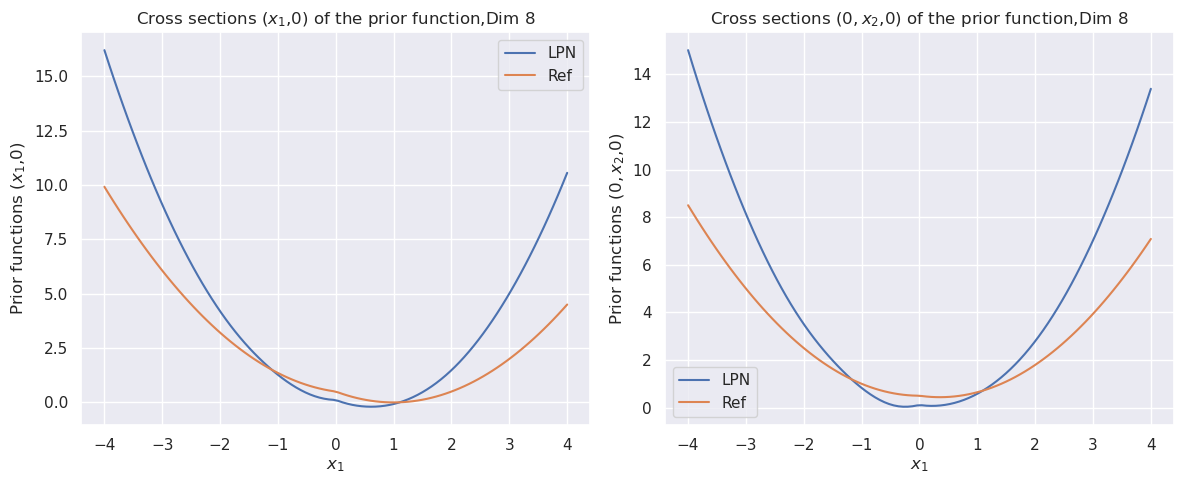
The image presents two line charts, both titled "Cross sections of the prior function, Dim 8". The charts visualize the relationship between a variable 'x1' and "Prior functions". The first chart displays the cross section at (x1, 0), while the second displays the cross section at (0, x2, 0). Each chart features two lines representing different models: "LPN" (blue) and "Ref" (orange).
### Components/Axes
Both charts share the following components:
* **Title:** "Cross sections (x1,0) of the prior function,Dim 8" (left chart) and "Cross sections (0, x2,0) of the prior function,Dim 8" (right chart).
* **X-axis Label:** "x1"
* **Y-axis Label:** "Prior functions (x1,0)" (left chart) and "Prior functions (0, x2,0)" (right chart).
* **X-axis Range:** Approximately -4 to 4.
* **Y-axis Range:** Left chart: Approximately 0 to 15. Right chart: Approximately 0 to 14.
* **Legend:** Located in the top-right corner of each chart, with "LPN" represented by a blue line and "Ref" by an orange line.
### Detailed Analysis or Content Details
**Left Chart: Cross sections (x1,0) of the prior function,Dim 8**
* **LPN (Blue Line):** The line exhibits a U-shaped curve. It starts at approximately 14.5 at x1 = -4, decreases to a minimum of approximately 0.2 at x1 = 0, and then increases to approximately 2.5 at x1 = 4.
* **Ref (Orange Line):** This line also forms a U-shaped curve, but is wider and flatter than the LPN line. It starts at approximately 3 at x1 = -4, reaches a minimum of approximately 0 at x1 = 0, and rises to approximately 3 at x1 = 4.
**Right Chart: Cross sections (0, x2,0) of the prior function,Dim 8**
* **LPN (Blue Line):** This line also exhibits a U-shaped curve. It starts at approximately 13 at x1 = -4, decreases to a minimum of approximately 1 at x1 = 0, and then increases to approximately 2.5 at x1 = 4.
* **Ref (Orange Line):** This line also forms a U-shaped curve, but is wider and flatter than the LPN line. It starts at approximately 2 at x1 = -4, reaches a minimum of approximately 0.2 at x1 = 0, and rises to approximately 2 at x1 = 4.
### Key Observations
* Both charts show that both the LPN and Ref models have a U-shaped relationship with x1.
* The LPN model consistently has higher values than the Ref model across most of the x1 range in both charts.
* The LPN model appears to be more sensitive to changes in x1, exhibiting a steeper curve than the Ref model.
* The minimum value of the LPN line is consistently higher than the minimum value of the Ref line.
### Interpretation
These charts likely represent the prior distributions of two models (LPN and Ref) over a single dimension (x1). The cross-sections provide insight into the shape of these distributions. The U-shaped curves suggest that values of x1 near 0 are less probable, while values further away from 0 are more probable.
The difference in the curves between LPN and Ref indicates that the two models have different prior beliefs about the distribution of x1. The LPN model appears to assign higher probability to values further from 0, and is more confident in its prior belief (steeper curve). The Ref model has a flatter, wider distribution, indicating more uncertainty.
The fact that both distributions are centered around x1 = 0 suggests that both models have a prior expectation that x1 is likely to be near zero, but the LPN model is more strongly biased towards values away from zero. The "Dim 8" in the titles suggests this is one dimension of an 8-dimensional space, and these cross-sections are being used to understand the prior distributions in each dimension.