## [Chart Type]: Dual Line Plot - Cross Sections of a Prior Function
### Overview
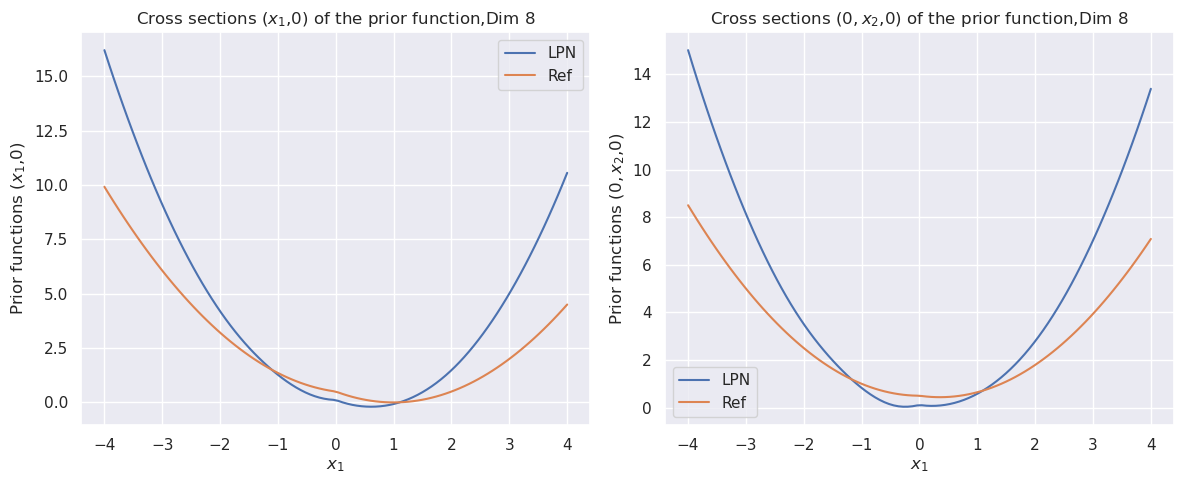
The image displays two side-by-side line charts, each plotting two functions ("LPN" and "Ref") against a single variable. The charts represent cross-sectional slices of a higher-dimensional (Dim 8) prior function. The left chart shows the function's behavior along the `x₁` axis with all other dimensions set to zero, while the right chart shows the behavior along the `x₂` axis with `x₁` and other dimensions set to zero. Both plots demonstrate parabolic, U-shaped curves.
### Components/Axes
**Common Elements:**
* **Plot Type:** 2D line charts.
* **Data Series:** Two series per plot.
* **LPN:** Represented by a blue line.
* **Ref:** Represented by an orange line.
* **Legend:** Located in the top-right corner of each plot's axes area. Contains colored line samples and labels "LPN" (blue) and "Ref" (orange).
* **Grid:** A light gray grid is present in the background of both plots.
**Left Plot:**
* **Title:** "Cross sections (x₁,0) of the prior function, Dim 8"
* **Y-axis Label:** "Prior functions (x₁,0)"
* **X-axis Label:** "x₁"
* **Y-axis Scale:** Linear, ranging from approximately 0.0 to 16.0. Major ticks at 0.0, 2.5, 5.0, 7.5, 10.0, 12.5, 15.0.
* **X-axis Scale:** Linear, ranging from -4 to 4. Major ticks at -4, -3, -2, -1, 0, 1, 2, 3, 4.
**Right Plot:**
* **Title:** "Cross sections (0, x₂,0) of the prior function, Dim 8"
* **Y-axis Label:** "Prior functions (0, x₂,0)"
* **X-axis Label:** "x₁" (Note: This appears to be a labeling inconsistency; based on the title, it should logically be `x₂`).
* **Y-axis Scale:** Linear, ranging from approximately 0.0 to 15.0. Major ticks at 0, 2, 4, 6, 8, 10, 12, 14.
* **X-axis Scale:** Linear, ranging from -4 to 4. Major ticks at -4, -3, -2, -1, 0, 1, 2, 3, 4.
### Detailed Analysis
**Left Plot - Cross section (x₁,0):**
* **Trend Verification:** Both the LPN (blue) and Ref (orange) lines form upward-opening parabolas. They decrease from the left, reach a minimum near x₁=0, and then increase to the right. The LPN curve is consistently above the Ref curve except near the minimum, where they converge.
* **Data Points (Approximate):**
* **At x₁ = -4:** LPN ≈ 16.0, Ref ≈ 10.0
* **At x₁ = -2:** LPN ≈ 4.0, Ref ≈ 2.5
* **At x₁ = 0 (Minimum):** LPN ≈ 0.0, Ref ≈ 0.0 (Both curves appear to touch or nearly touch the x-axis).
* **At x₁ = 2:** LPN ≈ 4.0, Ref ≈ 2.5
* **At x₁ = 4:** LPN ≈ 10.5, Ref ≈ 4.5
**Right Plot - Cross section (0, x₂,0):**
* **Trend Verification:** Similar to the left plot, both lines are upward-opening parabolas. The LPN (blue) curve is again above the Ref (orange) curve, with the gap widening as the absolute value of x₁ (presumably x₂) increases.
* **Data Points (Approximate):**
* **At x₁ (x₂) = -4:** LPN ≈ 15.0, Ref ≈ 8.5
* **At x₁ (x₂) = -2:** LPN ≈ 4.0, Ref ≈ 2.0
* **At x₁ (x₂) = 0 (Minimum):** LPN ≈ 0.0, Ref ≈ 0.5 (The Ref curve's minimum appears slightly above zero).
* **At x₁ (x₂) = 2:** LPN ≈ 4.0, Ref ≈ 2.0
* **At x₁ (x₂) = 4:** LPN ≈ 13.5, Ref ≈ 7.0
### Key Observations
1. **Consistent Hierarchy:** In both cross-sections, the "LPN" function yields higher values than the "Ref" function for the same input, except at the very bottom of the well where they are similar.
2. **Symmetry:** Both plots show near-perfect symmetry around the vertical axis (x=0), indicating the prior function is symmetric in these dimensions.
3. **Curvature Difference:** The LPN curve has a steeper curvature (a narrower, deeper "well") compared to the broader, shallower Ref curve. This is evident from the larger difference in values at the extremes (x=±4).
4. **Labeling Inconsistency:** The right plot's x-axis is labeled "x₁", but its title and y-axis label indicate it represents a cross-section along the `x₂` dimension. This is likely a typographical error in the chart generation.
### Interpretation
These charts compare two different prior probability distributions (LPN and Ref) over an 8-dimensional space by examining their behavior along two principal axes. The parabolic shape suggests these priors might be related to Gaussian or quadratic forms.
The key finding is that the **LPN prior is more "peaked" or "concentrated"** than the Ref prior. It assigns significantly higher probability density (or a related function value) to regions far from the origin (|x| > 2) while having a similar, near-zero density at the origin itself. This implies that the LPN model, compared to the Ref model, considers extreme values in any single dimension to be much more probable or "expected." The symmetry indicates this property is consistent across different dimensions of the space. The slight offset in the Ref curve's minimum on the right plot (≈0.5 at x=0) could be a numerical artifact or a subtle feature of that prior.