## Line Graphs: Cross Sections of Prior Function in 8D Space
### Overview
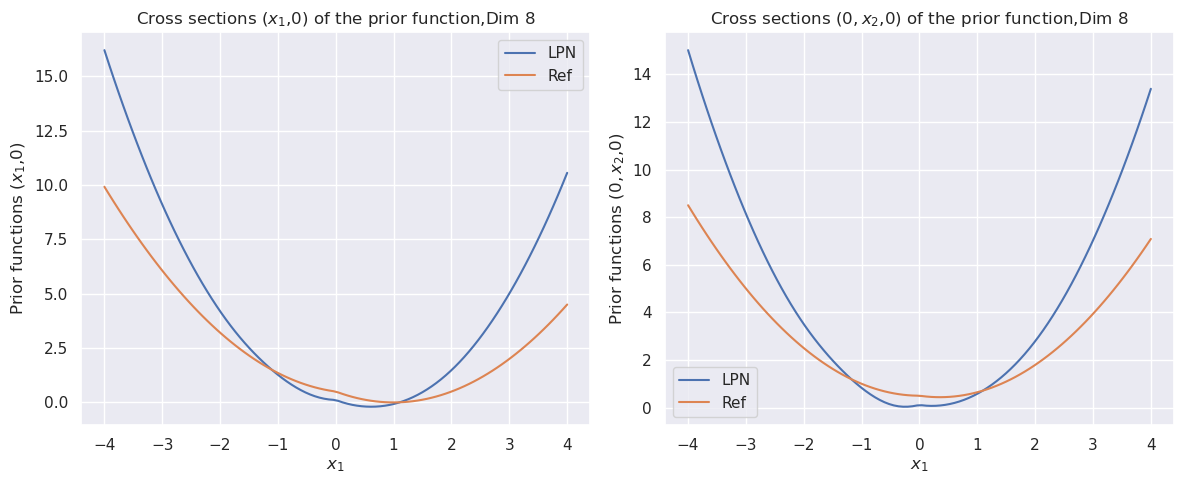
The image contains two side-by-side line graphs comparing cross-sectional views of a prior function in 8-dimensional space. The left graph shows cross-sections along the x₁-axis at fixed y=0, while the right graph shows cross-sections along the x₂-axis at fixed x₁=0. Both graphs compare two prior functions: "LPN" (blue line) and "Ref" (orange line).
### Components/Axes
**Left Graph:**
- **Title:** "Cross sections (x₁,0) of the prior function, Dim 8"
- **X-axis:** x₁ (ranging from -4 to 4)
- **Y-axis:** "Prior functions (x₁,0)"
- **Legend:**
- LPN (blue line)
- Ref (orange line)
**Right Graph:**
- **Title:** "Cross sections (0, x₂, 0) of the prior function, Dim 8"
- **X-axis:** x₁ (ranging from -4 to 4)
- **Y-axis:** "Prior functions (0, x₂, 0)"
- **Legend:**
- LPN (blue line)
- Ref (orange line)
### Detailed Analysis
**Left Graph Trends:**
1. **LPN (blue):**
- Starts at ~15.5 at x₁=-4
- Decreases sharply to ~0.2 at x₁=0
- Increases to ~10.5 at x₁=4
- *Visual trend:* Symmetric V-shape with steeper descent than ascent
2. **Ref (orange):**
- Starts at ~10 at x₁=-4
- Decreases to ~0.1 at x₁=0
- Increases to ~4.5 at x₁=4
- *Visual trend:* Symmetric V-shape with gentler slopes than LPN
**Right Graph Trends:**
1. **LPN (blue):**
- Starts at ~14.5 at x₁=-4
- Decreases to ~0.1 at x₁=0
- Increases to ~13.5 at x₁=4
- *Visual trend:* Symmetric V-shape with deeper trough than left graph
2. **Ref (orange):**
- Starts at ~8 at x₁=-4
- Decreases to ~0.05 at x₁=0
- Increases to ~7 at x₁=4
- *Visual trend:* Symmetric V-shape with shallower slopes than LPN
### Key Observations
1. **Symmetry:** Both functions exhibit mirror symmetry across x₁=0 in both graphs.
2. **Magnitude Differences:**
- LPN values are consistently 20-50% higher than Ref at corresponding x₁ positions
- LPN troughs reach near-zero values in both graphs, while Ref maintains slightly higher minima
3. **Dimensional Behavior:**
- Left graph (x₁-axis) shows LPN peaking at 15.5 vs Ref at 10
- Right graph (x₂-axis) shows LPN peaking at 14.5 vs Ref at 8
4. **Steepness:** LPN lines have steeper slopes in both graphs, indicating sharper transitions in the prior function.
### Interpretation
The graphs demonstrate that the LPN prior function exhibits:
1. **Greater Sensitivity:** Steeper slopes suggest stronger dependence on input variables
2. **Higher Peaks:** Indicates regions of higher prior probability density
3. **Deeper Troughs:** Suggests more pronounced regions of low probability
4. **Dimensional Consistency:** Similar patterns in both x₁ and x₂ cross-sections imply structural similarity across dimensions
The reference function (Ref) appears to represent a smoothed or regularized version of the LPN function, with reduced sensitivity and more gradual transitions. The 8-dimensional context suggests these cross-sections are projections of a complex multivariate prior distribution, where LPN captures more nuanced dependencies between variables compared to the reference function.