## Diagram: Comprehensive AI Agent Evaluation Framework
### Overview
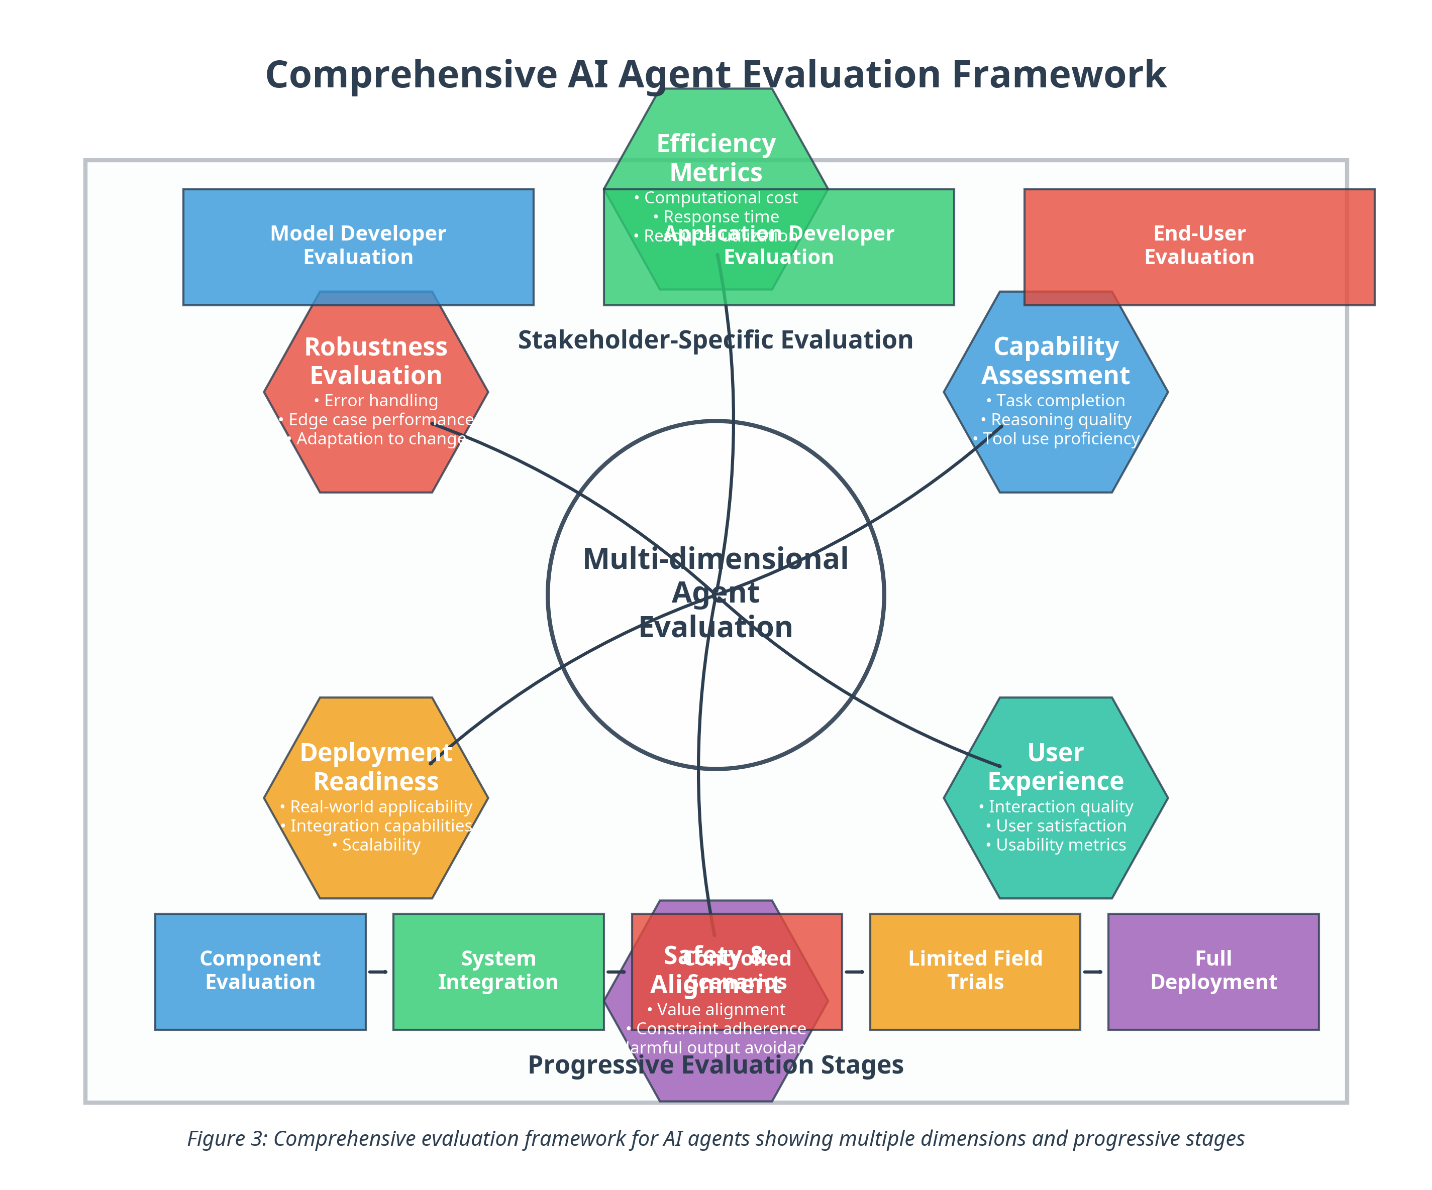
The image is a diagram illustrating a comprehensive evaluation framework for AI agents. It depicts a multi-dimensional evaluation process with stakeholder-specific evaluations and progressive evaluation stages. The diagram uses shapes and lines to connect different evaluation aspects, showing their relationships and flow.
### Components/Axes
* **Title:** Comprehensive AI Agent Evaluation Framework
* **Central Node:** Multi-dimensional Agent Evaluation (represented by a circle)
* **Stakeholder-Specific Evaluation:** This is a general category encompassing several specific evaluations.
* **Progressive Evaluation Stages:** This is a general category encompassing several specific stages.
* **Evaluation Categories (arranged around the central node):**
* Model Developer Evaluation (Blue Rectangle)
* Efficiency Metrics (Green Pentagon)
* Computational cost
* Response time
* Application Developer Evaluation
* End-User Evaluation (Red Rectangle)
* Robustness Evaluation (Red Hexagon)
* Error handling
* Edge case performance
* Adaptation to change
* Capability Assessment (Blue Hexagon)
* Task completion
* Reasoning quality
* Tool use proficiency
* User Experience (Teal Hexagon)
* Interaction quality
* User satisfaction
* Usability metrics
* Deployment Readiness (Orange Hexagon)
* Real-world applicability
* Integration capabilities
* Scalability
* Component Evaluation (Blue Rectangle)
* System Integration (Green Rectangle)
* Safety/Biased Alignments (Red Hexagon)
* Value alignment
* Constraint adherence
* Harmful output avoidance
* Limited Field Trials (Orange Rectangle)
* Full Deployment (Purple Rectangle)
* **Connectors:** Lines connecting the central "Multi-dimensional Agent Evaluation" node to the surrounding evaluation categories.
* **Caption:** Figure 3: Comprehensive evaluation framework for AI agents showing multiple dimensions and progressive stages
### Detailed Analysis or ### Content Details
* **Model Developer Evaluation:** Located at the top-left, represented by a blue rectangle.
* **Efficiency Metrics:** Located at the top-center, represented by a green pentagon. It includes "Computational cost", "Response time", and "Application Developer Evaluation".
* **End-User Evaluation:** Located at the top-right, represented by a red rectangle.
* **Robustness Evaluation:** Located to the left of the center, represented by a red hexagon. It includes "Error handling", "Edge case performance", and "Adaptation to change".
* **Capability Assessment:** Located to the right of the center, represented by a blue hexagon. It includes "Task completion", "Reasoning quality", and "Tool use proficiency".
* **User Experience:** Located at the bottom-right, represented by a teal hexagon. It includes "Interaction quality", "User satisfaction", and "Usability metrics".
* **Deployment Readiness:** Located at the bottom-left, represented by an orange hexagon. It includes "Real-world applicability", "Integration capabilities", and "Scalability".
* **Component Evaluation:** Located at the bottom-left, represented by a blue rectangle.
* **System Integration:** Located at the bottom-center-left, represented by a green rectangle.
* **Safety/Biased Alignments:** Located at the bottom-center, represented by a red hexagon. It includes "Value alignment", "Constraint adherence", and "Harmful output avoidance".
* **Limited Field Trials:** Located at the bottom-center-right, represented by an orange rectangle.
* **Full Deployment:** Located at the bottom-right, represented by a purple rectangle.
### Key Observations
* The diagram presents a structured approach to evaluating AI agents, considering multiple dimensions and stages.
* The central node emphasizes the multi-dimensional nature of the evaluation.
* The surrounding categories cover various aspects, from model development to real-world deployment.
* The use of different shapes and colors helps to visually distinguish the categories.
* The diagram suggests a flow from component evaluation and system integration to limited field trials and full deployment, representing progressive stages.
### Interpretation
The diagram illustrates a holistic framework for evaluating AI agents, emphasizing the importance of considering various factors throughout the development and deployment lifecycle. The framework highlights the need for stakeholder-specific evaluations, ensuring that the AI agent meets the needs and expectations of different users and developers. The progressive evaluation stages suggest a phased approach to deployment, allowing for continuous monitoring and improvement. The framework's multi-dimensional nature underscores the complexity of evaluating AI agents and the need for a comprehensive approach that considers both technical and ethical aspects.