# Technical Document Extraction: Flowchart Analysis
## Overview
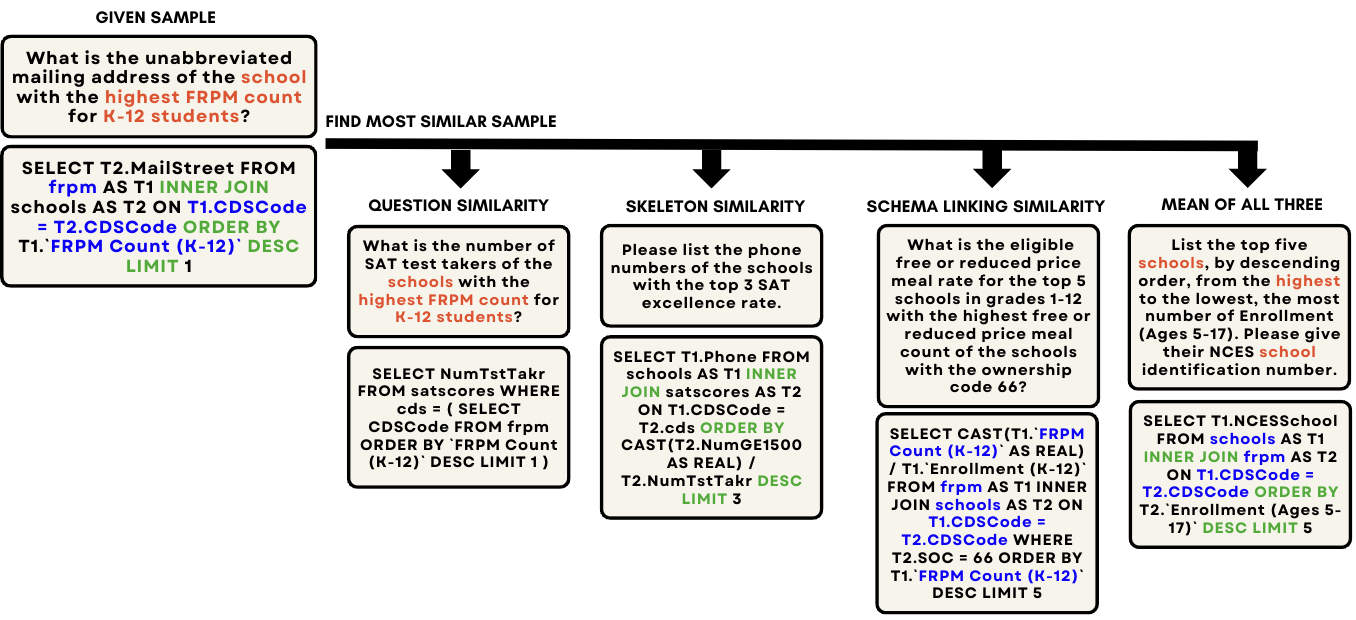
The image depicts a **decision flowchart** for identifying the most similar sample based on three similarity criteria:
1. **Question Similarity**
2. **Skeleton Similarity**
3. **Schema Linking Similarity**
4. **Mean of All Three**
The flowchart begins with a **GIVEN SAMPLE** and progresses through conditional logic to determine the optimal similarity match.
---
## Component Breakdown
### 1. GIVEN SAMPLE
**Text Block**:
```sql
What is the unabbreviated mailing address of the school with the highest FRPM count for K-12 students?
SELECT T2.MailStreet FROM frpm AS T1 INNER JOIN schools AS T2 ON T1.CDSCode = T2.CDSCode ORDER BY T1.FRPM Count (K-12) DESC LIMIT 1
```
---
### 2. FIND MOST SIMILAR SAMPLE
**Flow Arrows**:
- **Question Similarity**
- **Skeleton Similarity**
- **Schema Linking Similarity**
- **Mean of All Three**
---
### 3. QUESTION SIMILARITY
**Question**:
```text
What is the number of SAT test takers of schools with the highest FRPM count for K-12 students?
```
**SQL Query**:
```sql
SELECT NumTstTkr FROM satscores WHERE cds = (SELECT cds FROM frpm ORDER BY FRPM Count (K-12) DESC LIMIT 1)
```
---
### 4. SKELETON SIMILARITY
**Question**:
```text
Please list the phone numbers of the schools with the top 3 SAT numbers with the highest free or reduced price meal count.
```
**SQL Query**:
```sql
SELECT T1.Phone FROM schools AS T1 INNER JOIN satscores AS T2 ON T1.CDSCode = T2.CDSCode ORDER BY T2.NumGE1500 CAST(T2.NumTstTkr DESC) LIMIT 3
```
---
### 5. SCHEMA LINKING SIMILARITY
**Question**:
```text
What is the eligible free or reduced price meal rate for the top 5 schools in grades 1-12 with the highest free or reduced price meal count of the schools with the ownership code 66?
```
**SQL Query**:
```sql
SELECT CAST(T1.FRPM Count (K-12) / T1.Enrollment (K-12) AS REAL) FROM frpm AS T1 INNER JOIN schools AS T2 ON T1.CDSCode = T2.CDSCode WHERE T2.CDSCode = '66' ORDER BY T1.FRPM Count (K-12) DESC LIMIT 5
```
---
### 6. MEAN OF ALL THREE
**Question**:
```text
List the top five schools by descending order, from the highest to the lowest, the most number of Enrollment (Ages 5-17). Please give their NCEs school identification number.
```
**SQL Query**:
```sql
SELECT T1.NCESSchool FROM schools AS T1 INNER JOIN frpm AS T2 ON T1.CDSCode = T2.CDSCode ORDER BY T2.Enrollment (Ages 5-17) DESC LIMIT 5
```
---
## Key Observations
1. **Flow Logic**:
- The flowchart evaluates similarity through three criteria, culminating in a weighted mean.
- Each step includes a **question** and a **SQL query** to extract data.
2. **SQL Patterns**:
- Common use of `INNER JOIN` between `frpm` and `schools` tables.
- Frequent use of `ORDER BY` and `LIMIT` to prioritize results.
- Aggregation functions like `CAST` and arithmetic operations (e.g., `/` for rate calculation).
3. **Data Focus**:
- Emphasis on **K-12 student metrics** (FRPM count, SAT test takers, enrollment).
- Ownership code (`66`) and age ranges (`5-17`) are critical filters.
---
## Language and Formatting
- **Primary Language**: English (all text and SQL queries).
- **No Non-English Elements Detected**.
---
## Final Output Structure
The flowchart is a **decision tree** for data extraction, with each node representing a similarity criterion and its associated SQL query. The final output aggregates results from all three criteria to rank schools by relevance.