TECHNICAL ASSET FINGERPRINT
4e28d956bd04088fba70bcd0
Click to view fullscreen
Press ESC or click to close
FOUND IN PAPERS
EXPERT: gemini-2.5-flash-free VERSION 1
RUNTIME: google-free/gemini-2.5-flash
INTEL_VERIFIED
## Diagram: Reward Clipping and Delta Mechanisms
### Overview
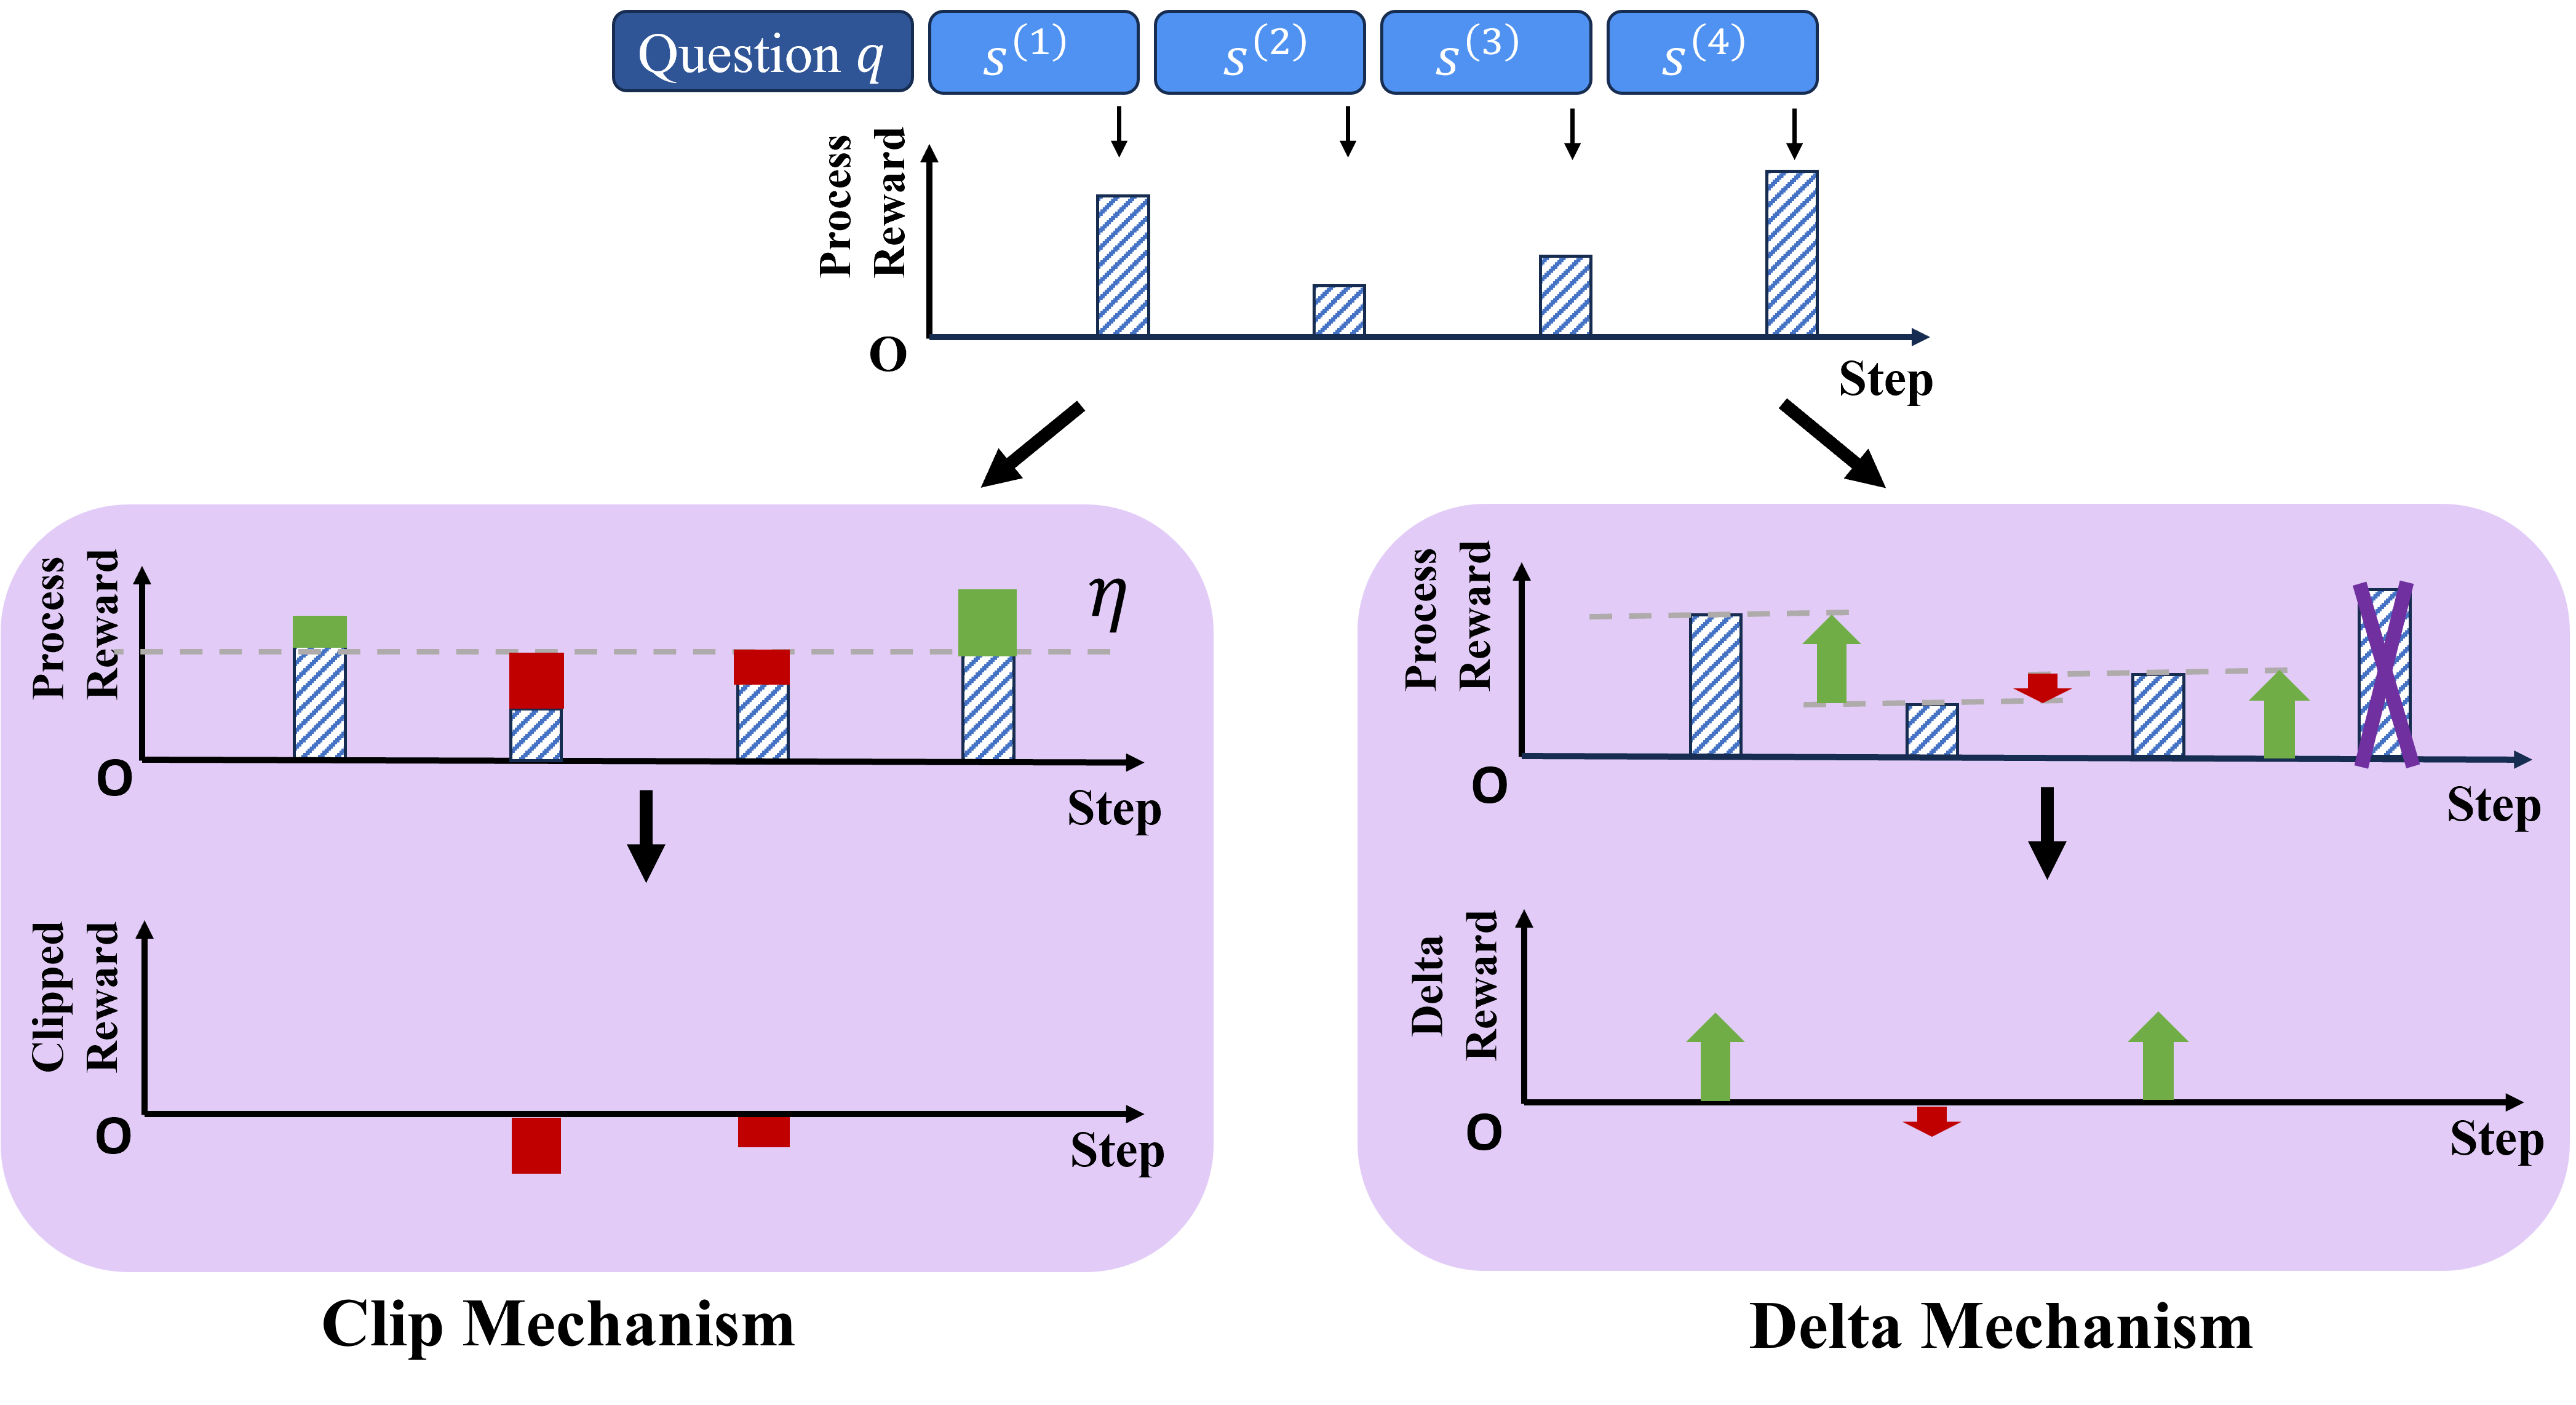
This image is a technical diagram illustrating two distinct reward processing mechanisms: "Clip Mechanism" and "Delta Mechanism." Both mechanisms operate on an initial sequence of "Process Reward" values associated with steps or states (S(1) to S(4)) for a given "Question q". The diagram uses bar charts to represent rewards and arrows to indicate transformations or derived values.
### Components/Axes
The diagram is structured into three main vertical sections:
1. **Top Section**: An initial bar chart representing "Process Reward" over "Step".
2. **Bottom-Left Section**: Titled "Clip Mechanism", containing two stacked bar charts.
3. **Bottom-Right Section**: Titled "Delta Mechanism", containing two bar charts with arrows.
**Common Elements Across Charts:**
* **Y-axis Label**: "Process Reward" (for the top chart and the upper charts in both mechanisms), "Clipped Reward" (for the bottom-left chart), "Delta Reward" (for the bottom-right chart).
* **X-axis Label**: "Step" (for all charts).
* **Origin**: Marked with "O" at the intersection of the X and Y axes for all charts.
* **Data Representation**: Bar charts are used.
* **Blue-striped pattern**: Represents the base "Process Reward" values.
* **Green solid color**: Represents a positive difference or excess reward.
* **Red solid color**: Represents a negative difference or deficit reward.
* **Purple-striped pattern with 'X'**: Indicates a reward value that is ignored or excluded.
* **Reference Line**: A dashed grey horizontal line is present in the upper charts of both the "Clip Mechanism" and "Delta Mechanism" sections. In the "Clip Mechanism" section, this line is explicitly labeled "η" (eta). This line serves as a threshold or baseline. Its value is approximately 60% of the maximum visible Y-axis height.
**Top Section Specifics:**
* **Header Labels**: "Question q" (left-aligned, blue rectangle), followed by "S(1)", "S(2)", "S(3)", "S(4)" (individual blue rectangles, representing steps or states). Downward arrows connect these state labels to their respective bars in the chart.
### Detailed Analysis
**1. Top Section: Initial Process Reward Chart**
This chart displays four blue-striped bars, representing the "Process Reward" for each step:
* **S(1)**: Reward value is approximately 75% of the maximum Y-axis height.
* **S(2)**: Reward value is approximately 25% of the maximum Y-axis height.
* **S(3)**: Reward value is approximately 45% of the maximum Y-axis height.
* **S(4)**: Reward value is approximately 90% of the maximum Y-axis height.
* **Trend**: The rewards fluctuate, starting high, dropping, rising again, and then reaching the highest value.
A thick black arrow points downwards from this top chart, splitting into two arrows, indicating that its output feeds into both the "Clip Mechanism" and "Delta Mechanism" sections below.
**2. Bottom-Left Section: Clip Mechanism**
This section is titled "Clip Mechanism" at the bottom. It contains two charts, one above the other, connected by a downward black arrow.
**2.1. Upper Chart (Process Reward with Clipping)**
* **Axes**: "Process Reward" (Y-axis), "Step" (X-axis).
* **Reference Line**: A dashed grey horizontal line labeled "η" is present at approximately 60% of the maximum Y-axis height.
* **Data Series**: Four bars, each representing a step, composed of blue-striped and either green or red segments:
* **Step 1**: The bar consists of a blue-striped segment up to the η line (approx. 60%) and a green solid segment on top, extending to the original reward height (approx. 75%). This indicates the original reward was above η, and the green part is the excess.
* **Step 2**: The bar consists of a blue-striped segment up to the original reward height (approx. 25%) and a red solid segment on top, extending up to the η line (approx. 60%). This indicates the original reward was below η, and the red part represents the deficit to reach η. The total displayed height is capped at η.
* **Step 3**: Similar to Step 2, the bar has a blue-striped segment up to the original reward height (approx. 45%) and a red solid segment on top, extending up to the η line (approx. 60%). The total displayed height is capped at η.
* **Step 4**: Similar to Step 1, the bar has a blue-striped segment up to the η line (approx. 60%) and a green solid segment on top, extending to the original reward height (approx. 90%).
**2.2. Lower Chart (Clipped Reward)**
* **Axes**: "Clipped Reward" (Y-axis), "Step" (X-axis). The Y-axis extends into negative values.
* **Data Series**: Two red solid bars, representing negative rewards:
* **Step 1**: No bar is present, indicating a clipped reward of zero.
* **Step 2**: A red solid bar extends downwards from the X-axis to approximately -35% of the maximum positive Y-axis height. This corresponds to the deficit (original reward 25% - η 60% = -35%).
* **Step 3**: A red solid bar extends downwards from the X-axis to approximately -15% of the maximum positive Y-axis height. This corresponds to the deficit (original reward 45% - η 60% = -15%).
* **Step 4**: No bar is present, indicating a clipped reward of zero.
* **Trend**: Only negative deviations from the threshold η are captured as "Clipped Reward". Positive deviations result in a zero clipped reward.
**3. Bottom-Right Section: Delta Mechanism**
This section is titled "Delta Mechanism" at the bottom. It contains two charts, one above the other, connected by a downward black arrow.
**3.1. Upper Chart (Process Reward with Delta)**
* **Axes**: "Process Reward" (Y-axis), "Step" (X-axis).
* **Reference Line**: A dashed grey horizontal line is present at approximately 60% of the maximum Y-axis height (consistent with η).
* **Data Series**: Four bars, each representing a step, with arrows or a cross-out:
* **Step 1**: A blue-striped bar extends to the original reward height (approx. 75%). A green upward arrow originates from the dashed line (60%) and points to the top of the bar (75%). This indicates a positive delta of approx. 15%.
* **Step 2**: A blue-striped bar extends to the original reward height (approx. 25%). A red downward arrow originates from the dashed line (60%) and points to the top of the bar (25%). This indicates a negative delta of approx. -35%.
* **Step 3**: A blue-striped bar extends to the original reward height (approx. 45%). A green upward arrow originates from the dashed line (60%) and points to a value approximately 70% of the maximum Y-axis height. This indicates a positive delta of approx. 10% (70% - 60%). Notably, this arrow does *not* point to the top of the blue-striped bar, suggesting the delta is not simply (original reward - threshold).
* **Step 4**: A blue-striped bar extends to the original reward height (approx. 90%). This bar is overlaid with a purple-striped 'X' pattern, indicating it is ignored or excluded from the delta calculation.
**3.2. Lower Chart (Delta Reward)**
* **Axes**: "Delta Reward" (Y-axis), "Step" (X-axis). The Y-axis extends into negative values.
* **Data Series**: Three arrows, representing positive or negative delta rewards:
* **Step 1**: A green upward arrow originates from the X-axis (0) and points to approximately 15% of the maximum positive Y-axis height. This matches the delta from the upper chart (75% - 60%).
* **Step 2**: A red downward arrow originates from the X-axis (0) and points to approximately -35% of the maximum positive Y-axis height. This matches the delta from the upper chart (25% - 60%).
* **Step 3**: A green upward arrow originates from the X-axis (0) and points to approximately 10% of the maximum positive Y-axis height. This matches the delta from the upper chart (70% - 60%).
* **Step 4**: No arrow is present, consistent with the exclusion in the upper chart.
* **Trend**: Both positive and negative delta values are captured.
### Key Observations
* **Consistent Initial Rewards**: The blue-striped bars representing "Process Reward" in the upper charts of both mechanisms appear to correspond to the initial "Process Reward" values from the top chart.
* **Clipping Behavior**: The "Clip Mechanism" caps the displayed "Process Reward" at the threshold η if the original reward is below it, filling the deficit with a red segment. For "Clipped Reward", it only outputs negative values (deficits) and zeroes for rewards above η.
* **Delta Behavior**: The "Delta Mechanism" calculates a "Delta Reward" relative to the dashed threshold line. For S(1) and S(2), this delta is (Process Reward - Threshold).
* **Anomaly in Delta Mechanism S(3)**: For Step 3 in the "Delta Mechanism", the "Process Reward" (blue-striped bar, ~45%) is below the threshold (~60%). However, the "Delta Reward" is shown as a positive value (~10%), indicated by a green upward arrow originating from the threshold and pointing above it. This suggests that the "Delta Reward" for S(3) is not simply the difference between the original "Process Reward" and the threshold, but rather an independently determined positive delta.
* **Exclusion in Delta Mechanism S(4)**: Step 4's reward is explicitly ignored or excluded in the "Delta Mechanism", as indicated by the purple-striped 'X' over its bar and the absence of a corresponding "Delta Reward".
### Interpretation
This diagram illustrates two distinct strategies for processing "Process Reward" values relative to a predefined threshold (η). Both mechanisms start with the same sequence of raw rewards but yield different outcomes, highlighting different objectives in reward shaping or evaluation.
The **Clip Mechanism** appears to be a form of penalty or normalization. When the "Process Reward" falls below the threshold η, the mechanism identifies the deficit (represented by the red segments and the "Clipped Reward" values). Rewards above η are effectively "clipped" in the sense that their excess is not explicitly captured as a "Clipped Reward" (it's zero). This mechanism might be used to penalize underperformance relative to a baseline, while not explicitly rewarding overperformance in the "clipped" output, or perhaps capping the perceived reward at η for display purposes. The "Clipped Reward" specifically quantifies the negative deviations.
The **Delta Mechanism** focuses on the *change* or *difference* from the threshold. For most steps (S(1), S(2)), it calculates the direct difference between the "Process Reward" and the threshold, capturing both positive (green arrows) and negative (red arrows) deviations. The notable exception is S(3), where despite the "Process Reward" being below the threshold, a positive "Delta Reward" is generated. This suggests that the "Delta Mechanism" can incorporate external or context-dependent factors that override a simple comparison to the threshold. It implies a more complex reward function where a positive delta can be assigned even if the raw process reward is low, perhaps due to effort or progress.
DECODING INTELLIGENCE...