## Box Plot: Daily Measurement Distribution (Days 1-24)
### Overview
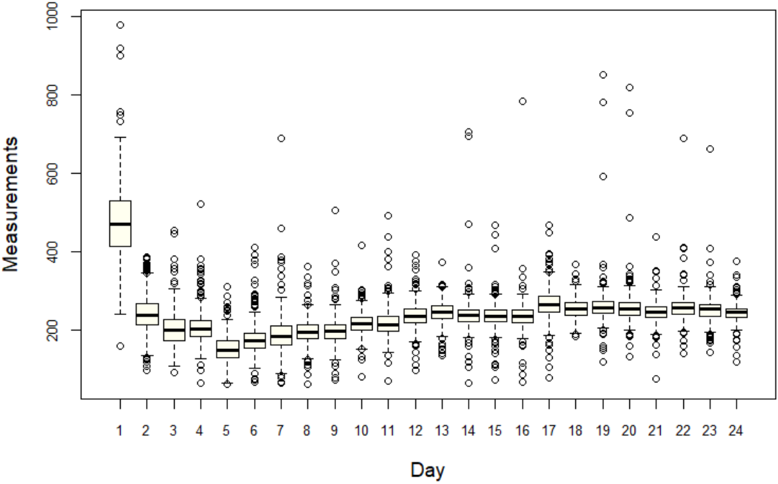
The image is a box-and-whisker plot (box plot) displaying the distribution of a quantitative variable labeled "Measurements" across 24 consecutive days. The plot visualizes central tendency, spread, and outliers for each day's dataset.
### Components/Axes
* **Chart Type:** Vertical Box Plot.
* **X-Axis:**
* **Label:** "Day"
* **Scale:** Categorical, with discrete markers for each integer from 1 to 24.
* **Y-Axis:**
* **Label:** "Measurements"
* **Scale:** Linear, numerical.
* **Range:** 0 to 1000.
* **Major Tick Marks:** At 0, 200, 400, 600, 800, 1000.
* **Legend:** None present. Each day's data is represented by an individual box plot.
* **Spatial Layout:** The plot area is bounded by a rectangular frame. The y-axis label is positioned vertically along the left edge. The x-axis label is centered below the day markers.
### Detailed Analysis
Each box plot consists of a central box, a median line, whiskers, and individual points for outliers.
**General Trend:** The median measurement value and the interquartile range (IQR, the height of the box) show a distinct pattern over the 24-day period. Day 1 exhibits the highest median and the largest spread. From Day 2 onward, the median drops significantly and remains relatively stable, with a slight, gradual upward trend from approximately Day 5 to Day 24. The spread (IQR and whisker length) also decreases after Day 1 and remains more consistent.
**Day-by-Day Approximate Values (Visual Estimation):**
* **Day 1:** Highest median (~480). Largest IQR (box spans ~400 to ~550). Longest whiskers, extending from ~250 to ~700. Multiple high outliers, with the highest point near 1000.
* **Day 2:** Median drops sharply to ~240. IQR narrows (box ~200 to ~280). Whiskers extend from ~100 to ~380. Several outliers above the top whisker.
* **Days 3-5:** Medians continue a slight decline, reaching a low point around Day 5 (~180). IQRs are relatively narrow.
* **Days 6-24:** Medians show a very gradual, slight upward trend, ending around ~250 on Day 24. The IQR for most days in this range is fairly consistent, with the box typically spanning approximately 50-70 units (e.g., from ~220 to ~270). Whisker lengths are also consistent.
* **Outliers:** Outliers (represented by open circles) are present on nearly every day. They are predominantly located above the top whisker, indicating a right-skewed distribution for most daily samples. The frequency and magnitude of high outliers are greatest on Day 1 and appear to decrease slightly over time, though they remain common. Low outliers (below the bottom whisker) are less frequent but appear on several days (e.g., Days 2, 3, 4, 7, 10, 11, 12, 19, 20).
### Key Observations
1. **Initial Anomaly:** Day 1 is a clear outlier in the time series, characterized by a much higher central value and greater variability than all subsequent days.
2. **Stabilization:** After the initial drop on Day 2, the process appears to stabilize. The median and spread from Day 2 onward are within a much narrower band compared to Day 1.
3. **Right-Skewed Distributions:** The consistent presence of outliers primarily above the boxes suggests that the underlying daily measurement distributions are right-skewed (positively skewed).
4. **Subtle Upward Drift:** Despite overall stability, there is a subtle but perceptible upward drift in the median value from the trough around Day 5 to the end of the period on Day 24.
### Interpretation
This box plot likely represents the monitoring of a process or system over 24 days. The data suggests a significant event or change occurred on Day 1, resulting in high and highly variable measurements. By Day 2, the system adjusted or was corrected, leading to a new, more stable operating state with lower typical values.
The persistent right skew (high outliers) indicates that while the process is stable on average, it is prone to occasional spikes or excursions to higher measurement values. The very gradual upward trend in the median from Day 5 onward could signal a slow drift in the process, a wearing-in effect, or a subtle environmental change influencing the measurements. This trend, while small, might be a leading indicator for future process behavior worth monitoring. The absence of a corresponding increase in spread (IQR) suggests the process variability itself remains controlled even as the central tendency shifts slightly.