## Box Plot: Daily Measurements Over 24 Days
### Overview
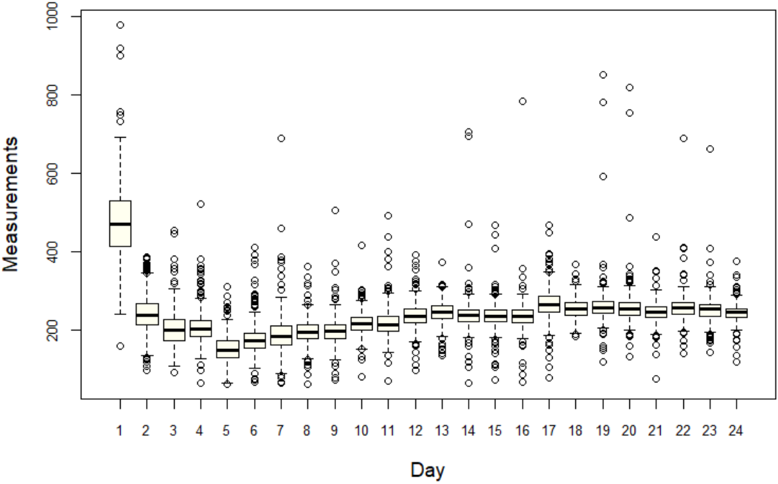
The image displays a box plot visualizing the distribution of measurements across 24 days. Each day is represented by a box plot showing the median, quartiles, and outliers. The y-axis ranges from 0 to 1000, while the x-axis lists days 1–24 sequentially.
### Components/Axes
- **X-axis (Horizontal)**: Labeled "Day," with discrete markers for days 1–24.
- **Y-axis (Vertical)**: Labeled "Measurements," scaled from 0 to 1000 in increments of 200.
- **Box Plot Elements**:
- **Boxes**: Represent the interquartile range (IQR) for each day.
- **Median Lines**: Horizontal black lines within each box.
- **Whiskers**: Extend to the minimum and maximum non-outlier values.
- **Outliers**: Marked as individual circles outside the whiskers.
### Detailed Analysis
- **Day 1**:
- Median ≈ 450.
- Outliers: Two points at ~950 and ~850.
- **Day 2**:
- Median ≈ 400.
- Outliers: One point at ~750.
- **Days 3–6**:
- Medians ≈ 200–300.
- Lower variability compared to Days 1–2.
- **Days 7–16**:
- Medians ≈ 200–250.
- Consistent IQR (~100–150).
- **Days 17–24**:
- Medians ≈ 250–300.
- Outliers: Days 17, 18, 22, 23, and 24 show points above ~600.
- **Outlier Distribution**:
- Highest outlier: Day 1 (~950).
- Lowest outliers: Days 17 and 18 (~150).
### Key Observations
1. **Initial Volatility**: Days 1–2 exhibit high median values and extreme outliers, suggesting anomalous measurements.
2. **Stabilization**: Days 7–16 show reduced variability, with medians clustering tightly around 200–250.
3. **Late-Day Increase**: Days 17–24 display a gradual rise in median values, accompanied by outliers exceeding 600.
4. **Outlier Patterns**: Outliers are concentrated on Days 1, 2, 17, 18, 22, 23, and 24, indicating potential external influences or data collection anomalies.
### Interpretation
The data suggests a dynamic system with three distinct phases:
1. **High-Variability Phase (Days 1–2)**: Extreme outliers and elevated medians may reflect startup effects, calibration issues, or external perturbations.
2. **Stable Phase (Days 7–16)**: Consistent measurements imply a controlled environment or equilibrium state.
3. **Recovery/Adjustment Phase (Days 17–24)**: Rising medians and late outliers could indicate system recovery, recalibration, or new stressors.
The presence of outliers on specific days warrants investigation into data collection protocols or contextual factors (e.g., environmental changes, equipment malfunctions). The overall trend lacks a clear directional bias but highlights cyclical variability, emphasizing the need for further analysis to identify underlying causes.