## Line Graph: Accuracy vs. Thinking Compute (Tokens in Thousands)
### Overview
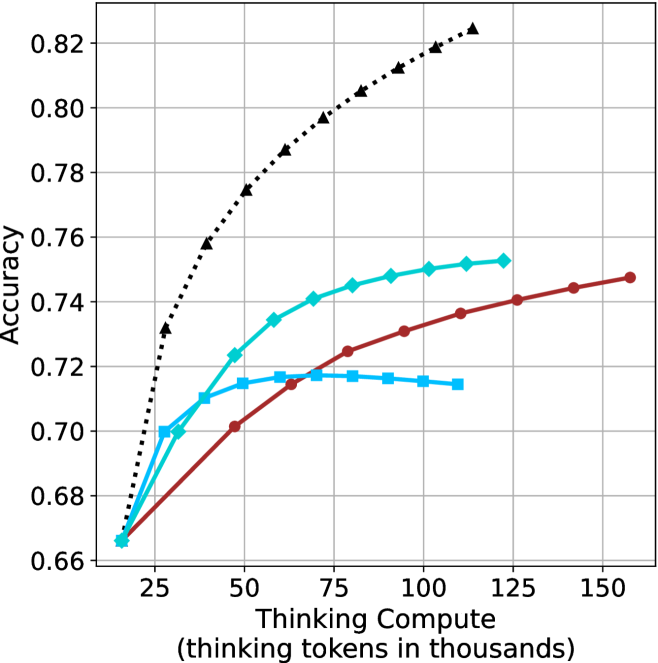
The graph illustrates the relationship between computational resources (measured in "thinking tokens in thousands") and accuracy performance across three distinct data series. The y-axis represents accuracy (0.66–0.82), while the x-axis spans computational load from 25 to 150 thousand tokens. Three lines are plotted: a black dotted line ("Baseline"), a teal line ("Optimized"), and a red line ("Advanced").
### Components/Axes
- **X-axis**: "Thinking Compute (thinking tokens in thousands)"
- Scale: 25 → 150 (increments of 25)
- **Y-axis**: "Accuracy"
- Scale: 0.66 → 0.82 (increments of 0.02)
- **Legend**: Right-aligned, with three entries:
- Black dotted line: "Baseline"
- Teal line: "Optimized"
- Red line: "Advanced"
### Detailed Analysis
1. **Baseline (Black Dotted Line)**
- Starts at (25, 0.66) and increases steadily.
- Key points:
- (50, 0.74)
- (75, 0.78)
- (100, 0.80)
- (125, 0.81)
- (150, 0.82)
- **Trend**: Linear growth with no plateau, suggesting unbounded improvement with compute.
2. **Optimized (Teal Line)**
- Starts at (25, 0.66) but plateaus after 50 tokens.
- Key points:
- (50, 0.72)
- (75, 0.72)
- (100, 0.72)
- (125, 0.72)
- (150, 0.72)
- **Trend**: Sharp initial gain (25→50 tokens) followed by stagnation.
3. **Advanced (Red Line)**
- Starts at (25, 0.66) and rises gradually.
- Key points:
- (50, 0.70)
- (75, 0.72)
- (100, 0.74)
- (125, 0.74)
- (150, 0.75)
- **Trend**: Moderate improvement with diminishing returns after 100 tokens.
### Key Observations
- **Baseline** demonstrates the steepest and most consistent improvement, reaching 0.82 accuracy at 150 tokens.
- **Optimized** shows early gains but no further improvement beyond 50 tokens, indicating a potential inefficiency or saturation point.
- **Advanced** exhibits the slowest growth, suggesting limited scalability despite higher computational demands.
- All lines originate at (25, 0.66), implying a baseline performance threshold at minimal compute.
### Interpretation
The data suggests that computational efficiency significantly impacts accuracy outcomes. The "Baseline" model’s linear scaling implies it may leverage compute more effectively, while the "Optimized" and "Advanced" models face diminishing returns, possibly due to architectural constraints or suboptimal resource allocation. The plateau in the "Optimized" line raises questions about its design—whether it prioritizes stability over scalability or encounters a fundamental limit. The "Advanced" model’s gradual improvement hints at a trade-off between complexity and practical gains. These trends underscore the importance of balancing compute investment with algorithmic efficiency to maximize performance.