## Diagram: Fake Misinformation Detection
### Overview
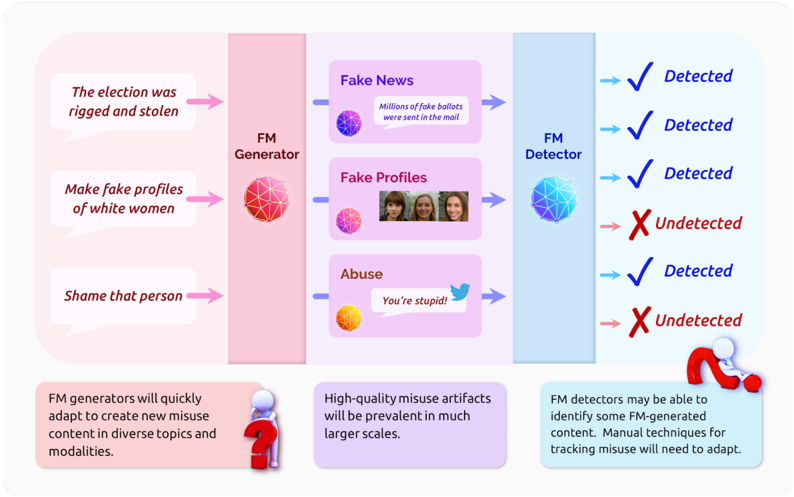
The image is a diagram illustrating the process of generating and detecting fake misinformation (FM). It shows how FM generators create various types of misinformation, and how FM detectors attempt to identify them. The diagram highlights the challenges in detecting all forms of misinformation.
### Components/Axes
The diagram is divided into three main sections:
1. **FM Generator (Left):** This section represents the source of misinformation. It includes examples of different types of misinformation and the "FM Generator" which is represented by a red/pink geometric sphere.
2. **Misinformation Examples (Center):** This section showcases specific examples of misinformation, including "Fake News," "Fake Profiles," and "Abuse."
3. **FM Detector (Right):** This section represents the system designed to detect misinformation. It shows the outcome of the detection process for each type of misinformation, with checkmarks indicating successful detection and crosses indicating failure. The "FM Detector" is represented by a blue geometric sphere.
### Detailed Analysis
* **FM Generator:**
* Located on the left side of the diagram.
* Generates three types of misinformation:
* "The election was rigged and stolen"
* "Make fake profiles of white women"
* "Shame that person"
* **Misinformation Examples:**
* **Fake News:**
* Text: "Millions of fake ballots were sent in the mail"
* **Fake Profiles:**
* Image: Three profile pictures of women.
* **Abuse:**
* Text: "You're stupid!"
* Includes a Twitter bird icon.
* **FM Detector:**
* Located on the right side of the diagram.
* Detection results:
* "The election was rigged and stolen" -> Detected (Green Checkmark)
* "Make fake profiles of white women" -> Detected (Green Checkmark)
* "Shame that person" -> Detected (Green Checkmark)
* "Fake News" -> Undetected (Red X)
* "Fake Profiles" -> Detected (Green Checkmark)
* "Abuse" -> Undetected (Red X)
* **Text Blocks:**
* Bottom-left: "FM generators will quickly adapt to create new misuse content in diverse topics and modalities."
* Bottom-center: "High-quality misuse artifacts will be prevalent in much larger scales."
* Bottom-right: "FM detectors may be able to identify some FM-generated content. Manual techniques for tracking misuse will need to adapt."
### Key Observations
* The diagram highlights that while some forms of misinformation are detected, others are not.
* The "Fake News" and "Abuse" examples are shown as undetected, suggesting these types of misinformation are more difficult to identify.
* The text blocks at the bottom emphasize the evolving nature of misinformation and the need for detectors to adapt.
### Interpretation
The diagram illustrates the ongoing challenge of combating misinformation. While FM detectors can identify some forms of misinformation, the generators are constantly evolving, creating new and more sophisticated types of misuse. This requires continuous improvement and adaptation of detection techniques to stay ahead of the evolving threat landscape. The diagram suggests that a multi-faceted approach is needed, including both automated detection and manual analysis, to effectively address the problem of misinformation.