## Diagram: FM Generator and Detector Workflow for Misuse Content
### Overview
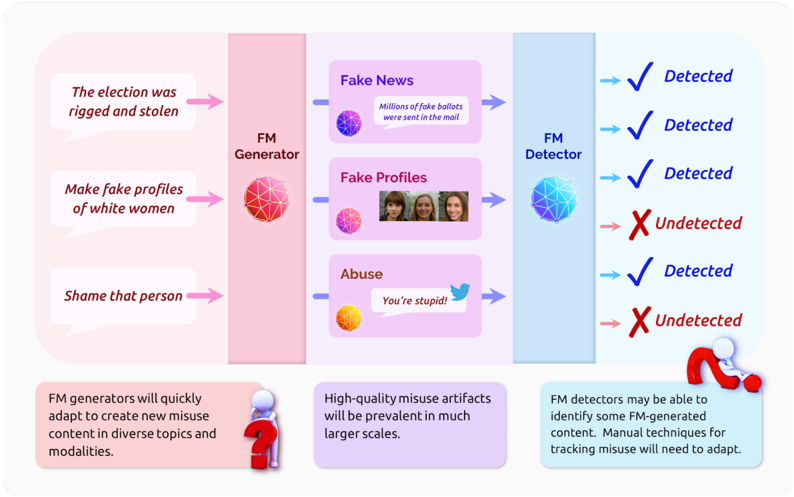
This image is a conceptual flowchart diagram illustrating the process and challenges of generating and detecting misuse content created by Foundation Models (FMs). It depicts a pipeline from malicious intent to generated content and its subsequent detection, accompanied by explanatory notes on future implications.
### Components/Axes
The diagram is structured into three main vertical sections, flowing from left to right, with a footer containing three explanatory text boxes.
**1. Left Section (Input/Intent):**
* **Background Color:** Light pink.
* **Components:** Three speech bubbles containing malicious prompts or intents.
* **Top Bubble:** Text: "The election was rigged and stolen"
* **Middle Bubble:** Text: "Make fake profiles of white women"
* **Bottom Bubble:** Text: "Shame that person"
* **Flow:** Pink arrows point from each bubble to the central "FM Generator" block.
**2. Central Section (Processing):**
* **FM Generator Block:** A vertical pink bar labeled "FM Generator" with a red/pink geometric sphere icon.
* **Generated Content Types:** Three purple boxes, each representing a category of misuse content, connected by blue arrows from the FM Generator.
* **Top Box (Fake News):** Title: "Fake News". Contains a purple sphere icon and example text: "Millions of fake ballots were sent in the mail".
* **Middle Box (Fake Profiles):** Title: "Fake Profiles". Contains a pink sphere icon and a small image showing three female faces.
* **Bottom Box (Abuse):** Title: "Abuse". Contains an orange/yellow sphere icon and example text: "You're stupid!" next to a blue bird (Twitter) icon.
* **FM Detector Block:** A vertical light blue bar labeled "FM Detector" with a blue geometric sphere icon. Blue arrows point from each content type box to this detector.
**3. Right Section (Output/Detection Results):**
* **Background Color:** Light blue.
* **Components:** A list of detection outcomes, each preceded by a blue arrow from the FM Detector.
* **Result 1:** Blue checkmark (✓) followed by text: "Detected"
* **Result 2:** Blue checkmark (✓) followed by text: "Detected"
* **Result 3:** Blue checkmark (✓) followed by text: "Detected"
* **Result 4:** Red X mark (✗) followed by text: "Undetected"
* **Result 5:** Blue checkmark (✓) followed by text: "Detected"
* **Result 6:** Red X mark (✗) followed by text: "Undetected"
* **Spatial Note:** The results are listed vertically. The "Undetected" results (4 and 6) are interspersed among the "Detected" results.
**4. Footer (Explanatory Notes):**
Three text boxes with rounded corners, each with a small 3D figure icon and a question mark or magnifying glass.
* **Left Box (Pink background):** Text: "FM generators will quickly adapt to create new misuse content in diverse topics and modalities." Icon: A figure with a red question mark.
* **Center Box (Purple background):** Text: "High-quality misuse artifacts will be prevalent in much larger scales." Icon: A figure with a red question mark.
* **Right Box (Light blue background):** Text: "FM detectors may be able to identify some FM-generated content. Manual techniques for tracking misuse will need to adapt." Icon: A figure with a red magnifying glass.
### Detailed Analysis
The diagram maps specific inputs to generated content types and their detection outcomes:
* **Input 1 ("The election was rigged...")** → Generates **Fake News** → Result: **Detected**.
* **Input 2 ("Make fake profiles...")** → Generates **Fake Profiles** → Result: **Detected**.
* **Input 3 ("Shame that person")** → Generates **Abuse** → Result: **Detected**.
* The diagram then shows three additional, unlinked detection results: two more "Detected" and two "Undetected" outcomes. This implies that for the three generated content types shown, detection is not uniformly successful; some instances evade detection.
### Key Observations
1. **Variable Detection Success:** The core observation is that FM detectors are not foolproof. While the diagram shows a "Detected" result for each of the three example content types, it explicitly includes "Undetected" outcomes, indicating a significant failure rate.
2. **Adaptation Arms Race:** The footer notes frame this as a dynamic challenge. Generators will adapt to new topics and modalities, while detectors and manual tracking techniques must also evolve.
3. **Scale and Quality:** The central note emphasizes that the problem is not just about detection accuracy but also about the anticipated large-scale proliferation of high-quality fake content.
4. **Visual Coding:** Color is used consistently to group concepts: pink for generation/intent, purple for content artifacts, and blue for detection.
### Interpretation
This diagram serves as a conceptual model for understanding the threat landscape of AI-generated misuse content. It argues that the process is a continuous cycle of attack and defense:
* **The Threat Pipeline:** Malicious human intent is operationalized through FM generators to produce specific, harmful content types (disinformation, impersonation, harassment).
* **The Imperfect Shield:** FM detectors act as a defensive layer but are presented as having inconsistent efficacy. The interspersed "Undetected" results are a critical visual cue that current detection methods are unreliable.
* **The Future Challenge:** The footer text moves beyond the simple flowchart to present a thesis: this is an escalating problem. The generators' ability to quickly adapt and produce content at scale will outpace static detection methods. Therefore, the diagram implies that reliance solely on automated FM detectors is insufficient. A combination of improved detection AI, adapted manual investigation techniques, and possibly other societal or regulatory measures will be necessary to mitigate the risks of FM-generated misuse. The image is less a technical specification and more a warning about the evolving nature of digital misinformation and abuse.