## Chart Type: Receiver Operating Characteristic (ROC) Curves
### Overview
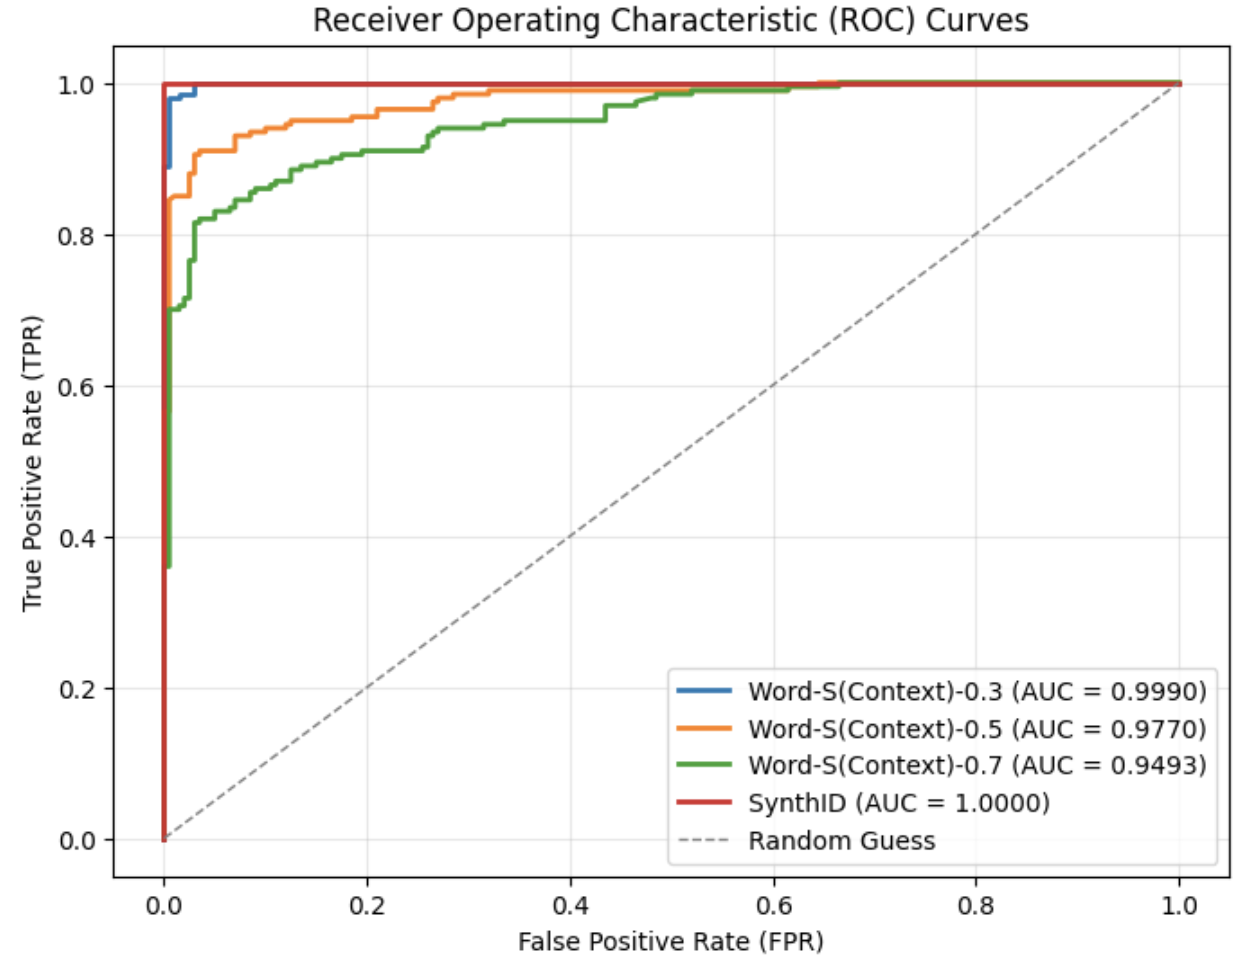
The image is a Receiver Operating Characteristic (ROC) curve chart comparing the performance of different models: Word-S(Context)-0.3, Word-S(Context)-0.5, Word-S(Context)-0.7, and SynthID, against a random guess baseline. The chart plots the True Positive Rate (TPR) against the False Positive Rate (FPR). The Area Under the Curve (AUC) is provided for each model.
### Components/Axes
* **Title:** Receiver Operating Characteristic (ROC) Curves
* **X-axis:** False Positive Rate (FPR), ranging from 0.0 to 1.0 in increments of 0.2.
* **Y-axis:** True Positive Rate (TPR), ranging from 0.0 to 1.0 in increments of 0.2.
* **Legend:** Located in the bottom-right corner of the chart.
* Blue line: Word-S(Context)-0.3 (AUC = 0.9990)
* Orange line: Word-S(Context)-0.5 (AUC = 0.9770)
* Green line: Word-S(Context)-0.7 (AUC = 0.9493)
* Red line: SynthID (AUC = 1.0000)
* Dashed gray line: Random Guess
### Detailed Analysis
* **Word-S(Context)-0.3 (Blue):** The blue line rises sharply to a TPR of approximately 0.95 at a very low FPR (close to 0.0), then plateaus near 1.0.
* **Word-S(Context)-0.5 (Orange):** The orange line rises sharply to a TPR of approximately 0.82 at a very low FPR (close to 0.0), then plateaus near 1.0.
* **Word-S(Context)-0.7 (Green):** The green line rises to a TPR of approximately 0.72 at a very low FPR (close to 0.0), then gradually increases to approximately 0.95 before plateauing near 1.0.
* **SynthID (Red):** The red line rises vertically to a TPR of approximately 0.35 at an FPR of 0.0, then jumps to 1.0 at an FPR of approximately 0.01, and remains at 1.0.
* **Random Guess (Dashed Gray):** The dashed gray line represents a diagonal line from (0.0, 0.0) to (1.0, 1.0), indicating performance equivalent to random guessing.
### Key Observations
* SynthID has the highest AUC (1.0000), followed by Word-S(Context)-0.3 (0.9990), Word-S(Context)-0.5 (0.9770), and Word-S(Context)-0.7 (0.9493).
* The SynthID model achieves perfect performance, with a TPR of 1.0 at a very low FPR.
* All models outperform the random guess baseline.
* Word-S(Context)-0.3 performs better than Word-S(Context)-0.5, which performs better than Word-S(Context)-0.7.
### Interpretation
The ROC curves illustrate the performance of different models in terms of their ability to discriminate between positive and negative cases. A higher AUC indicates better performance. The SynthID model demonstrates perfect classification, while the Word-S(Context) models show varying degrees of effectiveness, with Word-S(Context)-0.3 being the most effective among them. The fact that all models are above the random guess line indicates they all have some predictive power. The differences in performance among the Word-S(Context) models suggest that the context parameter influences the model's accuracy.