## Line Chart: ΔP vs. Layer for Mistral Models
### Overview
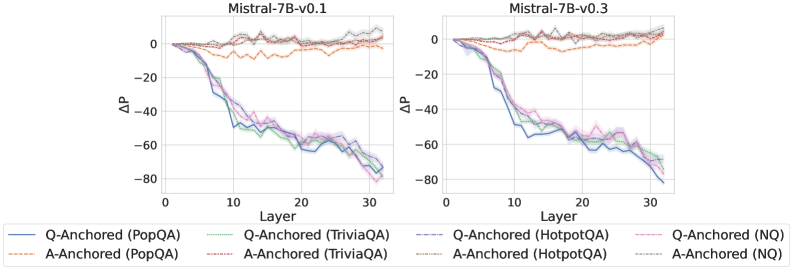
The image presents two line charts, side-by-side, comparing the change in performance (ΔP) across layers for two versions of the Mistral-7B language model: v0.1 and v0.3. Each chart displays multiple lines representing different question-answering datasets and anchoring methods. The x-axis represents the layer number, ranging from 0 to 30, while the y-axis represents ΔP, ranging from approximately -80 to 0.
### Components/Axes
* **Title (Left Chart):** Mistral-7B-v0.1
* **Title (Right Chart):** Mistral-7B-v0.3
* **X-axis Label (Both Charts):** Layer
* **Y-axis Label (Both Charts):** ΔP
* **Legend (Bottom Center):**
* Blue Line: Q-Anchored (PopQA)
* Orange Line: A-Anchored (PopQA)
* Green Line: Q-Anchored (TriviaQA)
* Light Blue Line: A-Anchored (TriviaQA)
* Red Line: Q-Anchored (HotpotQA)
* Brown Line: A-Anchored (HotpotQA)
* Purple Line: Q-Anchored (NQ)
* Pink Line: A-Anchored (NQ)
### Detailed Analysis or Content Details
**Mistral-7B-v0.1 (Left Chart):**
* **Q-Anchored (PopQA) - Blue Line:** Starts at approximately 0 at Layer 0, decreases steadily to approximately -65 at Layer 30.
* **A-Anchored (PopQA) - Orange Line:** Starts at approximately 0 at Layer 0, decreases to approximately -55 at Layer 30.
* **Q-Anchored (TriviaQA) - Green Line:** Starts at approximately 0 at Layer 0, decreases to approximately -60 at Layer 30.
* **A-Anchored (TriviaQA) - Light Blue Line:** Starts at approximately 0 at Layer 0, decreases to approximately -50 at Layer 30.
* **Q-Anchored (HotpotQA) - Red Line:** Starts at approximately 0 at Layer 0, decreases to approximately -70 at Layer 30.
* **A-Anchored (HotpotQA) - Brown Line:** Starts at approximately 0 at Layer 0, decreases to approximately -60 at Layer 30.
* **Q-Anchored (NQ) - Purple Line:** Starts at approximately 0 at Layer 0, decreases to approximately -75 at Layer 30.
* **A-Anchored (NQ) - Pink Line:** Starts at approximately 0 at Layer 0, decreases to approximately -65 at Layer 30.
**Mistral-7B-v0.3 (Right Chart):**
* **Q-Anchored (PopQA) - Blue Line:** Starts at approximately 0 at Layer 0, decreases to approximately -60 at Layer 30.
* **A-Anchored (PopQA) - Orange Line:** Starts at approximately 0 at Layer 0, decreases to approximately -50 at Layer 30.
* **Q-Anchored (TriviaQA) - Green Line:** Starts at approximately 0 at Layer 0, decreases to approximately -55 at Layer 30.
* **A-Anchored (TriviaQA) - Light Blue Line:** Starts at approximately 0 at Layer 0, decreases to approximately -45 at Layer 30.
* **Q-Anchored (HotpotQA) - Red Line:** Starts at approximately 0 at Layer 0, decreases to approximately -65 at Layer 30.
* **A-Anchored (HotpotQA) - Brown Line:** Starts at approximately 0 at Layer 0, decreases to approximately -55 at Layer 30.
* **Q-Anchored (NQ) - Purple Line:** Starts at approximately 0 at Layer 0, decreases to approximately -70 at Layer 30.
* **A-Anchored (NQ) - Pink Line:** Starts at approximately 0 at Layer 0, decreases to approximately -60 at Layer 30.
In both charts, all lines generally exhibit a downward trend, indicating a decrease in ΔP as the layer number increases. The rate of decrease appears to be relatively consistent across layers, with some variations between datasets and anchoring methods.
### Key Observations
* The NQ dataset consistently shows the largest decrease in ΔP for both Q-Anchored and A-Anchored methods in both models.
* The PopQA dataset generally shows the smallest decrease in ΔP.
* The v0.3 model consistently shows a smaller decrease in ΔP across all datasets and anchoring methods compared to the v0.1 model. This suggests an improvement in performance with the newer version.
* The Q-Anchored methods generally show a larger decrease in ΔP than the A-Anchored methods for each dataset.
### Interpretation
The charts illustrate how the performance of the Mistral-7B models changes across different layers of the network when evaluated on various question-answering datasets. The ΔP metric likely represents a measure of performance difference, with negative values indicating a decline in performance.
The consistent downward trend across all lines suggests that the models' performance degrades as information propagates through deeper layers. This could be due to issues like vanishing gradients or the loss of relevant information during processing.
The differences between datasets highlight the models' varying abilities to handle different types of questions. The NQ dataset, which likely contains more complex or nuanced questions, results in a more significant performance drop.
The improvement observed in the v0.3 model suggests that the updates made between versions have mitigated some of the performance degradation issues, potentially through architectural changes or improved training techniques. The difference between Q-Anchored and A-Anchored methods could be related to how the model utilizes question versus answer context during processing. The anchoring method impacts the performance, suggesting that the way the model is prompted or conditioned affects its ability to maintain performance across layers.