\n
## Line Charts: Mistral-7B Model Layer-wise ΔP Analysis
### Overview
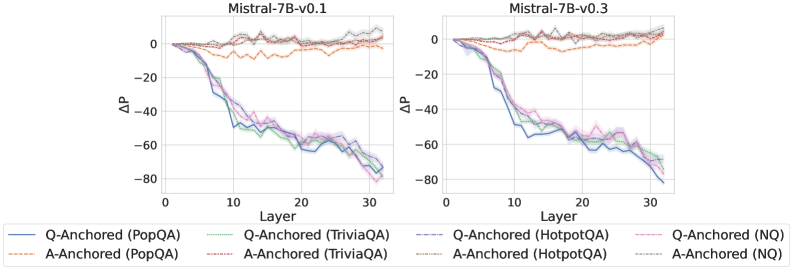
The image displays two side-by-side line charts comparing the performance change (ΔP) across the 32 layers of two versions of the Mistral-7B language model: "Mistral-7B-v0.1" (left) and "Mistral-7B-v0.3" (right). Each chart plots the ΔP metric for four different question-answering datasets, using two distinct anchoring methods ("Q-Anchored" and "A-Anchored").
### Components/Axes
* **Chart Titles:** "Mistral-7B-v0.1" (left chart), "Mistral-7B-v0.3" (right chart).
* **X-Axis:** Labeled "Layer". Linear scale from 0 to 30, with major tick marks at 0, 10, 20, and 30. Represents the transformer layer index within the model.
* **Y-Axis:** Labeled "ΔP". Linear scale from -80 to 0, with major tick marks at -80, -60, -40, -20, and 0. Represents a change in a performance or probability metric.
* **Legend:** Positioned at the bottom, spanning both charts. It defines 8 data series using a combination of color and line style:
* **Solid Lines (Q-Anchored):**
* Blue: Q-Anchored (PopQA)
* Green: Q-Anchored (TriviaQA)
* Purple: Q-Anchored (HotpotQA)
* Pink: Q-Anchored (NQ)
* **Dashed Lines (A-Anchored):**
* Orange: A-Anchored (PopQA)
* Red: A-Anchored (TriviaQA)
* Brown: A-Anchored (HotpotQA)
* Gray: A-Anchored (NQ)
### Detailed Analysis
**Trend Verification & Data Points (Approximate):**
**1. Mistral-7B-v0.1 (Left Chart):**
* **Q-Anchored Series (Solid Lines):** All four lines exhibit a strong, consistent downward trend. They start near ΔP = 0 at Layer 0 and decline steeply, reaching between -70 and -80 by Layer 32.
* *Blue (PopQA):* Drops to ~-60 by Layer 15, ends near -75.
* *Green (TriviaQA):* Follows a very similar path to Blue, ending near -75.
* *Purple (HotpotQA):* Slightly less steep initially, but converges with the others, ending near -75.
* *Pink (NQ):* Follows the same general trend, ending near -75.
* **A-Anchored Series (Dashed Lines):** All four lines remain relatively flat and close to ΔP = 0 throughout all layers, with minor fluctuations.
* *Orange (PopQA):* Fluctuates between approximately +5 and -10.
* *Red (TriviaQA):* Fluctuates between approximately +5 and -15, with a notable dip around Layer 10.
* *Brown (HotpotQA):* Fluctuates tightly around 0, mostly between +5 and -5.
* *Gray (NQ):* Fluctuates around 0, mostly between +5 and -5.
**2. Mistral-7B-v0.3 (Right Chart):**
* **Q-Anchored Series (Solid Lines):** The same strong downward trend is present. The decline appears slightly steeper in the early layers (0-10) compared to v0.1.
* *Blue (PopQA):* Drops to ~-60 by Layer 10, ends near -80.
* *Green (TriviaQA):* Very similar to Blue, ends near -80.
* *Purple (HotpotQA):* Follows closely, ends near -80.
* *Pink (NQ):* Follows the trend, ends near -80.
* **A-Anchored Series (Dashed Lines):** Again, these lines remain flat near ΔP = 0.
* *Orange (PopQA):* Fluctuates between approximately +5 and -10.
* *Red (TriviaQA):* Fluctuates between approximately +5 and -10.
* *Brown (HotpotQA):* Fluctuates tightly around 0.
* *Gray (NQ):* Fluctuates tightly around 0.
### Key Observations
1. **Method Dichotomy:** There is a stark, consistent contrast between the two anchoring methods across both model versions and all four datasets. Q-Anchored methods cause ΔP to plummet with model depth, while A-Anchored methods keep ΔP stable near zero.
2. **Dataset Consistency:** Within each anchoring method, the behavior across the four different QA datasets (PopQA, TriviaQA, HotpotQA, NQ) is remarkably similar. The lines for each method are tightly clustered.
3. **Model Version Similarity:** The overall patterns are nearly identical between Mistral-7B-v0.1 and v0.3. The primary difference is a slightly more pronounced early decline in the Q-Anchored lines for v0.3.
4. **Layer Sensitivity:** The Q-Anchored effect is layer-dependent, showing a near-linear negative correlation with layer index. The A-Anchored effect is layer-invariant.
### Interpretation
This visualization demonstrates a fundamental difference in how two types of "anchoring" (likely referring to prompt engineering or attention mechanisms) affect the internal processing of a large language model across its layers.
* **Q-Anchoring (Question-Anchored):** This method appears to progressively suppress or alter a specific probability metric (ΔP) as information flows through the network. The consistent negative trend suggests that focusing on the question leads to a cumulative reduction in whatever P represents (perhaps the probability of a default or prior answer) from early to late layers. The uniformity across datasets implies this is a general architectural response, not task-specific.
* **A-Anchoring (Answer-Anchored):** This method maintains the metric ΔP at a baseline level (near zero change) throughout the network. This suggests that anchoring to the answer stabilizes the model's internal representations with respect to this metric, preventing the layer-wise drift seen with Q-Anchoring.
**In essence, the choice of anchoring fundamentally rewires the model's internal computational trajectory.** Q-Anchoring induces a strong, depth-dependent transformation, while A-Anchoring preserves a stable state. The fact that this pattern holds across model versions and diverse QA datasets points to a core mechanistic property of the Mistral-7B architecture being revealed by this analysis. The outlier is the slight dip in the A-Anchored TriviaQA line in v0.1, which may indicate a minor, dataset-specific instability in that model version.