## Line Chart: ΔP vs Layer for Mistral-7B Models (v0.1 and v0.3)
### Overview
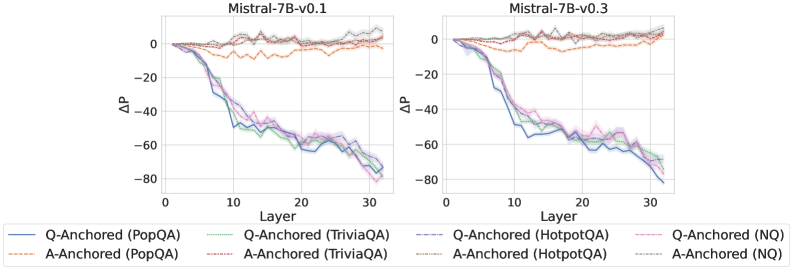
The image contains two side-by-side line charts comparing the performance of Mistral-7B models (v0.1 and v0.3) across different datasets and anchoring methods. Each chart tracks the change in ΔP (y-axis) across 30 layers (x-axis). Six distinct data series are plotted per model version, differentiated by line style and color.
---
### Components/Axes
- **X-Axis (Layer)**: Ranges from 0 to 30, labeled "Layer".
- **Y-Axis (ΔP)**: Ranges from -80 to 0, labeled "ΔP".
- **Legends**:
- **Left Chart (v0.1)**:
- Solid lines: Q-Anchored (PopQA, TriviaQA, HotpotQA, NQ)
- Dashed lines: A-Anchored (PopQA, TriviaQA, HotpotQA, NQ)
- **Right Chart (v0.3)**:
- Same legend structure as v0.1, with updated line trends.
- **Line Styles/Colors**:
- PopQA: Blue (solid), Orange (dashed)
- TriviaQA: Green (solid), Red (dashed)
- HotpotQA: Purple (solid), Brown (dashed)
- NQ: Pink (solid), Gray (dashed)
---
### Detailed Analysis
#### Mistral-7B-v0.1
- **Q-Anchored (PopQA)**: Starts at ~0, drops sharply to ~-60 by layer 10, stabilizes at ~-60.
- **A-Anchored (PopQA)**: Starts at ~0, declines gradually to ~-40 by layer 30.
- **Q-Anchored (TriviaQA)**: Similar to PopQA but with sharper fluctuations (e.g., -50 to -70).
- **A-Anchored (TriviaQA)**: Less steep decline, ends near -50.
- **Q-Anchored (HotpotQA)**: Starts at ~0, drops to ~-70 by layer 20, then stabilizes.
- **A-Anchored (HotpotQA)**: Declines slowly to ~-50.
- **Q-Anchored (NQ)**: Minimal drop (-10 to -20).
- **A-Anchored (NQ)**: Stable near 0.
#### Mistral-7B-v0.3
- **Q-Anchored (PopQA)**: Starts at ~0, drops to ~-50 by layer 10, stabilizes.
- **A-Anchored (PopQA)**: Declines to ~-35 by layer 30.
- **Q-Anchored (TriviaQA)**: Slightly improved stability vs v0.1, ends near -60.
- **A-Anchored (TriviaQA)**: Ends near -45.
- **Q-Anchored (HotpotQA)**: Drops to ~-65 by layer 20, stabilizes.
- **A-Anchored (HotpotQA)**: Ends near -40.
- **Q-Anchored (NQ)**: Minimal drop (-5 to -15).
- **A-Anchored (NQ)**: Stable near 0.
---
### Key Observations
1. **Q-Anchored vs A-Anchored**: Q-Anchored methods consistently show steeper ΔP declines, especially in early layers (0–10).
2. **Model Version Comparison**: v0.3 generally maintains higher ΔP values than v0.1 across datasets, indicating improved performance.
3. **Dataset Variability**:
- PopQA and TriviaQA show the largest ΔP drops.
- NQ datasets exhibit minimal changes, suggesting lower sensitivity to anchoring.
4. **Layer Dependency**: All datasets exhibit ΔP stabilization after layer 20, with v0.3 showing earlier convergence.
---
### Interpretation
The data demonstrates that **Q-Anchored methods** (question-focused anchoring) lead to more significant ΔP reductions compared to **A-Anchored methods** (answer-focused anchoring), particularly in early layers. This suggests Q-Anchored approaches may prioritize question-context alignment at the expense of stability. The v0.3 model’s improved ΔP retention across datasets implies architectural or training optimizations that enhance robustness. Notably, the NQ dataset’s minimal ΔP changes indicate it is less affected by anchoring strategies, possibly due to simpler question structures. The stabilization after layer 20 suggests diminishing returns in anchoring impact as the model depth increases.