## Bar Chart: Overall Accuracy Comparison
### Overview
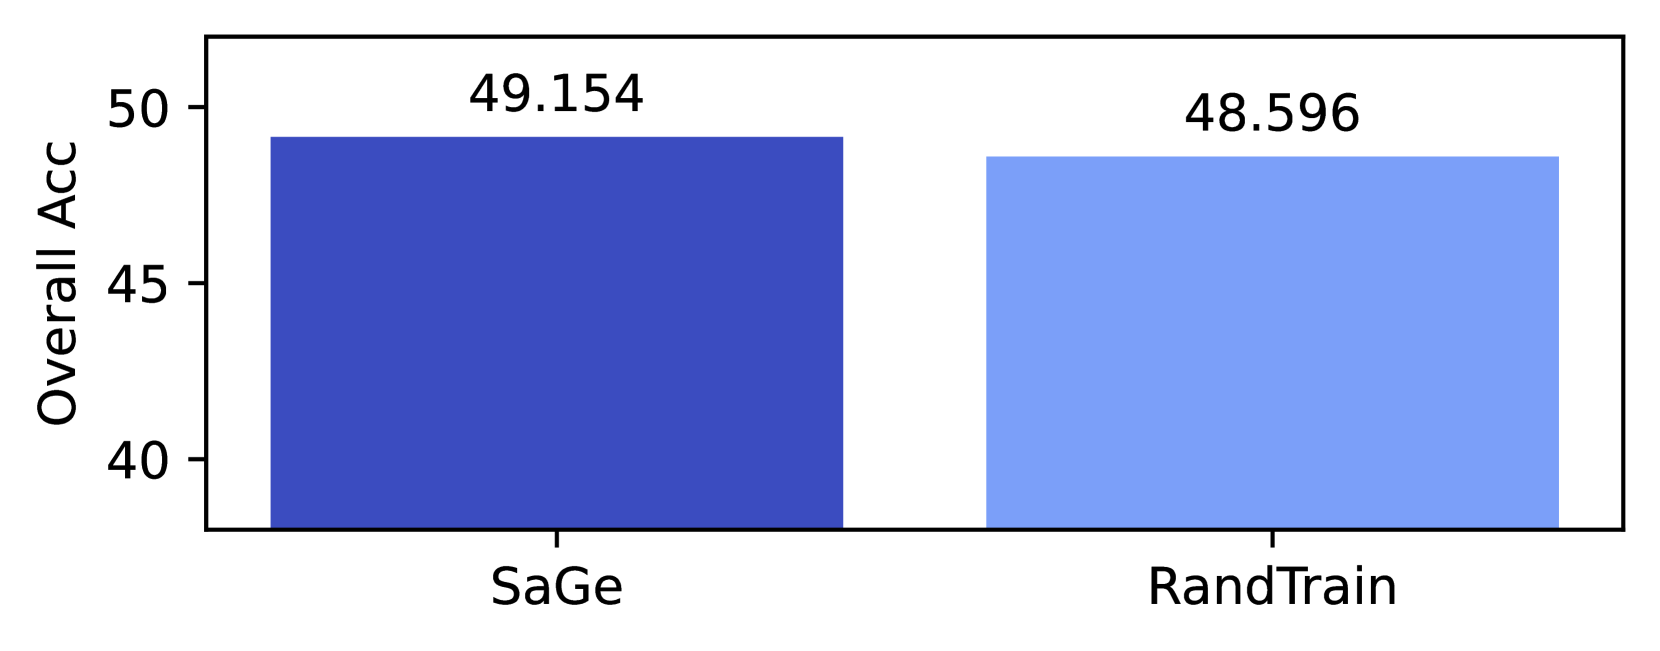
The image is a bar chart comparing the overall accuracy of two methods: SaGe and RandTrain. The chart displays the accuracy values for each method using vertical bars.
### Components/Axes
* **X-axis:** Categorical axis with two categories: "SaGe" and "RandTrain".
* **Y-axis:** Numerical axis labeled "Overall Acc" ranging from 40 to 50, with tick marks at 40, 45, and 50.
* **Bars:** Two bars representing the accuracy of each method.
* SaGe: Dark blue bar.
* RandTrain: Light blue bar.
* **Values:** Numerical values displayed above each bar.
* SaGe: 49.154
* RandTrain: 48.596
### Detailed Analysis
* **SaGe:** The dark blue bar representing SaGe reaches a height corresponding to an accuracy of 49.154.
* **RandTrain:** The light blue bar representing RandTrain reaches a height corresponding to an accuracy of 48.596.
### Key Observations
* SaGe has a slightly higher overall accuracy (49.154) compared to RandTrain (48.596).
* The difference in accuracy between the two methods is approximately 0.558.
### Interpretation
The bar chart visually demonstrates that the SaGe method achieves a marginally better overall accuracy than the RandTrain method. The difference, while present, is relatively small, suggesting that both methods perform similarly in terms of overall accuracy. Further analysis might be needed to determine if this difference is statistically significant or practically meaningful in the context of the specific application.