\n
## Bar Chart: Overall Accuracy Comparison
### Overview
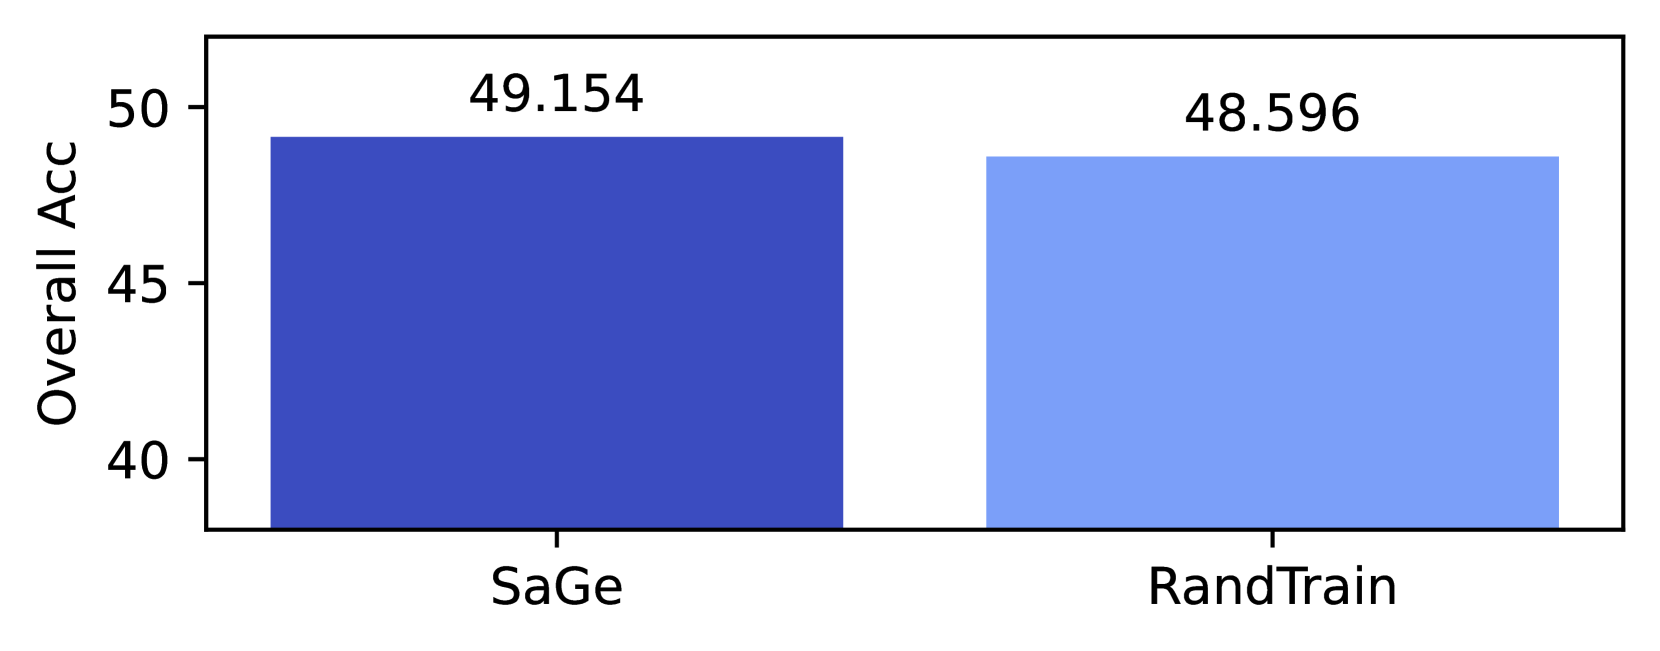
This image presents a bar chart comparing the "Overall ACC" (Accuracy) of two methods: "SaGe" and "RandTrain". The chart uses vertical bars to represent the accuracy scores for each method.
### Components/Axes
* **X-axis:** Represents the methods being compared: "SaGe" and "RandTrain".
* **Y-axis:** Labeled "Overall ACC", representing the overall accuracy score. The scale ranges from approximately 35 to 50, with markings at 40, 45, and 50.
* **Bars:** Two vertical bars, one for each method. The bar for "SaGe" is a darker shade of blue, while the bar for "RandTrain" is a lighter shade of blue.
* **Data Labels:** Each bar is labeled with its corresponding accuracy value, positioned above the bar.
### Detailed Analysis
* **SaGe:** The bar for "SaGe" reaches a height corresponding to approximately 49.154 on the "Overall ACC" scale. The bar is positioned on the left side of the chart.
* **RandTrain:** The bar for "RandTrain" reaches a height corresponding to approximately 48.596 on the "Overall ACC" scale. The bar is positioned on the right side of the chart.
* **Trend:** The "SaGe" bar is slightly taller than the "RandTrain" bar, indicating a higher accuracy score.
### Key Observations
* "SaGe" demonstrates a slightly higher overall accuracy compared to "RandTrain".
* The difference in accuracy between the two methods is relatively small, approximately 0.558 (49.154 - 48.596).
### Interpretation
The data suggests that the "SaGe" method achieves a marginally better overall accuracy than the "RandTrain" method. This could indicate that "SaGe" is a more effective approach for the task being evaluated, although the difference is not substantial. Further investigation might be needed to determine if this difference is statistically significant and whether it warrants choosing "SaGe" over "RandTrain" in practical applications. The chart provides a direct comparison of the performance of these two methods based on the "Overall ACC" metric.