## Bar Chart: Comparison of Overall Accuracy between SaGe and RandTrain
### Overview
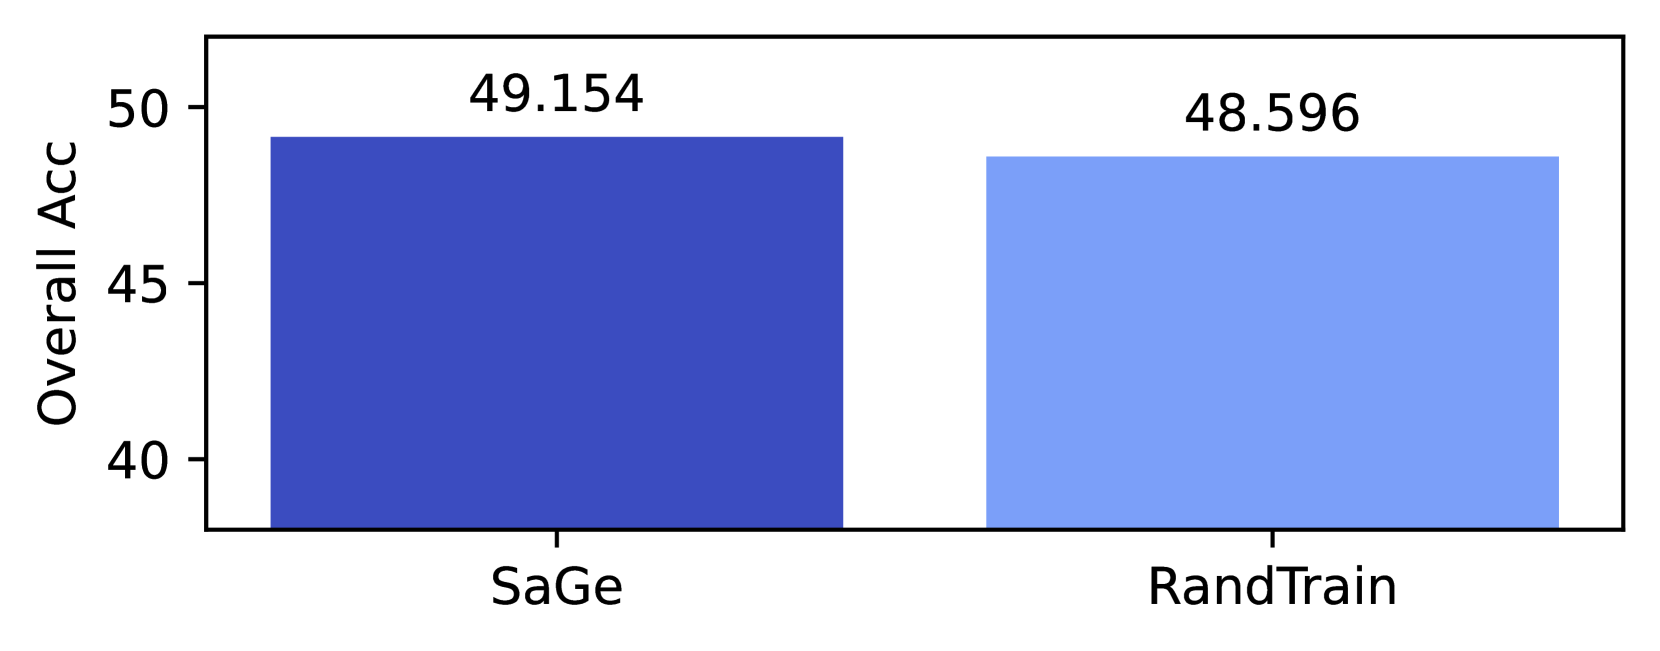
The image is a bar chart comparing the **Overall Accuracy (Overall Acc)** of two methods: **SaGe** and **RandTrain**. The y-axis represents accuracy values ranging from 40 to 50, while the x-axis lists the two methods. The chart uses two distinct colors to differentiate the methods, with numerical values displayed above each bar.
---
### Components/Axes
- **Y-Axis**: Labeled "Overall Acc" with a scale from 40 to 50 in increments of 5.
- **X-Axis**: Categories labeled "SaGe" (left) and "RandTrain" (right).
- **Legend**: Positioned on the right side of the chart, associating:
- **Dark Blue** with **SaGe**.
- **Light Blue** with **RandTrain**.
- **Values**:
- SaGe: **49.154** (dark blue bar).
- RandTrain: **48.596** (light blue bar).
---
### Detailed Analysis
- The **SaGe** method achieves an Overall Accuracy of **49.154**, slightly higher than **RandTrain** (48.596).
- The difference between the two methods is **0.558** (49.154 - 48.596), indicating a marginal advantage for SaGe.
- Both bars are nearly equal in height, suggesting similar performance levels, but SaGe edges out RandTrain by a small margin.
---
### Key Observations
1. **SaGe** outperforms **RandTrain** by approximately **0.558** in Overall Accuracy.
2. The chart emphasizes precision, with values provided to three decimal places.
3. The color coding (dark blue for SaGe, light blue for RandTrain) aligns with the legend for clarity.
---
### Interpretation
The data suggests that **SaGe** is marginally more accurate than **RandTrain** in the evaluated context. While the difference is small, it may hold significance depending on the application's sensitivity to accuracy thresholds. The near-equal performance implies that both methods are robust, but SaGe’s slight edge could make it preferable in scenarios where even minor improvements matter. The chart’s focus on precision (three decimal places) underscores the importance of fine-grained evaluation in this comparison.