## Diagram:KeplerAgent System Architecture and Mathematical Model
### Overview
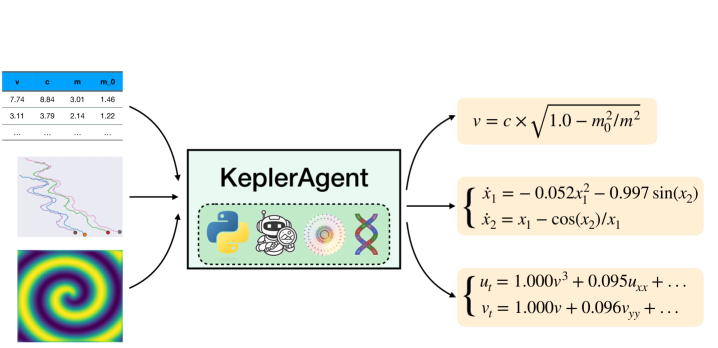
The diagram illustrates a computational system labeled "KeplerAgent" integrating mathematical equations, data tables, and visualizations. It combines symbolic representations (equations), tabular data, and graphical outputs to model a dynamic system. Key components include:
- A central "KeplerAgent" box with icons representing Python, robotics, DNA, and a spiral.
- Mathematical equations defining velocity, coordinate transformations, and recursive variables.
- A tabular dataset with numerical values and a line plot with multiple colored trajectories.
- A spiral heatmap visualization.
### Components/Axes
1. **KeplerAgent Box**:
- Contains icons: Python (🐍), robot (🤖), DNA (🧬), and a spiral (🌀).
- Positioned centrally, acting as the system's core.
2. **Mathematical Equations**:
- **Velocity Formula**:
`v = c × √(1.0 - m₀²/m²)`
- `c`: Speed of light (implicit constant).
- `m₀`: Rest mass, `m`: relativistic mass.
- **Coordinate Transformations**:
`ẋ₁ = -0.052x₁² - 0.997sin(x₂)`
`ẋ₂ = x₁ - cos(x₂)/x₁`
- **Recursive Variables**:
`uₜ = 1.000v³ + 0.095uₓₓ + ...`
`vₜ = 1.000v + 0.096vᵧᵧ + ...`
3. **Tabular Data**:
- Columns: `v`, `c`, `m`, `m₀`.
- Rows:
- Row 1: `7.74`, `8.84`, `3.01`, `1.46`
- Row 2: `3.11`, `3.79`, `2.14`, `1.22`
- Subsequent rows: Placeholder ellipses (`...`).
4. **Visualizations**:
- **Line Plot**:
- Multiple colored trajectories (red, blue, green, etc.) with no explicit legend.
- Positioned below the table, showing dynamic paths.
- **Spiral Heatmap**:
- Concentric circular patterns with gradient colors (purple → yellow).
- Located at the bottom-left, suggesting radial data distribution.
### Detailed Analysis
- **Tabular Data**:
The table lists parameters `v`, `c`, `m`, and `m₀` with approximate values. For example:
- First row: `v = 7.74`, `c = 8.84`, `m = 3.01`, `m₀ = 1.46`.
- Second row: `v = 3.11`, `c = 3.79`, `m = 2.14`, `m₀ = 1.22`.
- Uncertainty: Values are approximate, with no explicit error margins.
- **Equations**:
- The velocity formula resembles relativistic physics, where `v` depends on mass ratios.
- Coordinate transformations (`ẋ₁`, `ẋ₂`) suggest nonlinear dynamics, possibly modeling oscillatory or chaotic systems.
- Recursive variables (`uₜ`, `vₜ`) imply iterative updates, common in agent-based modeling.
- **Visualizations**:
- The line plot’s colored trajectories may represent agent paths or system states over time.
- The spiral heatmap’s gradient could encode intensity or probability distributions, though no legend clarifies this.
### Key Observations
1. **Relativistic Context**: The velocity formula aligns with special relativity, where `v` approaches `c` as `m₀/m` approaches 1.
2. **Nonlinear Dynamics**: The coordinate transformations (`ẋ₁`, `ẋ₂`) involve quadratic and trigonometric terms, hinting at complex system behavior.
3. **Recursive Updates**: The `uₜ` and `vₜ` equations suggest iterative processes, possibly for simulation or optimization.
4. **Visual Ambiguity**: The line plot lacks a legend, making it unclear how colors map to data categories. The spiral heatmap’s gradient is qualitative without a scale.
### Interpretation
- **System Purpose**: The KeplerAgent likely models a physical or computational system involving relativistic motion, nonlinear dynamics, and iterative updates. The icons (Python, robot, DNA) suggest interdisciplinary applications (e.g., AI, biology, physics).
- **Data Relationships**: The table parameters (`v`, `c`, `m`, `m₀`) likely feed into the equations, with the visualizations showing simulation outcomes or empirical data.
- **Uncertainties**: Missing legends for plots and absence of error margins in the table limit quantitative interpretation. The spiral heatmap’s purpose remains speculative without axis labels.
### Conclusion
This diagram represents a hybrid system blending mathematical modeling (relativity, dynamics) with computational tools (Python, robotics). The absence of explicit legends and error margins highlights gaps in data transparency, urging further clarification for rigorous analysis.