## Diagram: KeplerAgent Workflow
### Overview
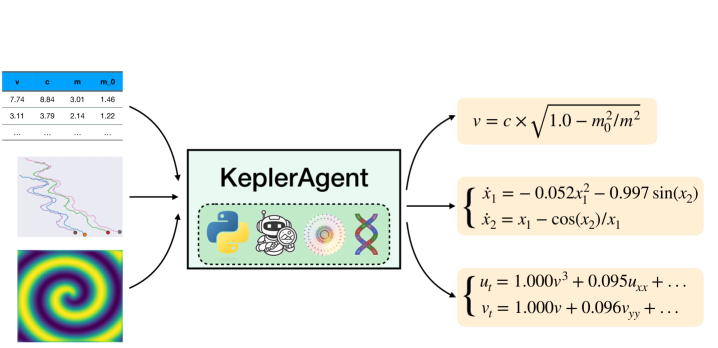
The image depicts a diagram illustrating the workflow of a "KeplerAgent." It shows inputs on the left side (a data table, a trajectory plot, and a spiral pattern image) flowing into the KeplerAgent, and outputs on the right side (mathematical equations).
### Components/Axes
* **KeplerAgent:** A central rectangular block labeled "KeplerAgent" in a light green box. Below the label, there are four icons: a Python logo, a robot icon, a circular pattern, and a DNA double helix. The icons are contained within a box with a dashed border.
* **Inputs (Left Side):**
* **Data Table:** A table with column headers "v", "c", "m", and "m0". Two rows of numerical data are visible.
* **Trajectory Plot:** A plot showing three trajectories in blue, green, and red, each ending with a colored circle.
* **Spiral Pattern Image:** A square image displaying a spiral pattern with colors ranging from yellow to purple.
* **Outputs (Right Side):** Three light-yellow boxes containing mathematical equations.
* **Arrows:** Curved arrows indicate the flow of information from the inputs to the KeplerAgent and from the KeplerAgent to the outputs.
### Detailed Analysis or Content Details
* **Data Table:**
* Column headers: v, c, m, m0
* Row 1: v = 7.74, c = 8.84, m = 3.01, m0 = 1.46
* Row 2: v = 3.11, c = 3.79, m = 2.14, m0 = 1.22
* **Trajectory Plot:** Three trajectories are shown. The blue trajectory starts at the top and meanders down. The green trajectory starts in the middle and also meanders down. The red trajectory starts at the bottom and moves slightly to the right.
* **Spiral Pattern Image:** The spiral pattern consists of concentric rings that vary in color from yellow in the center to purple at the edges.
* **Mathematical Equations:**
* Equation 1: v = c * sqrt(1.0 - m0^2/m^2)
* Equation 2:
* x1_dot = -0.052x1^2 - 0.997sin(x2)
* x2_dot = x1 - cos(x2)/x1
* Equation 3:
* ut = 1.000v^3 + 0.095uxx + ...
* vt = 1.000v + 0.096vyy + ...
### Key Observations
* The KeplerAgent takes numerical data, trajectory information, and a spiral pattern as inputs.
* The KeplerAgent outputs mathematical equations related to velocity and dynamics.
* The icons below the KeplerAgent label suggest the use of Python, robotics, and potentially data analysis or genetic algorithms.
### Interpretation
The diagram illustrates a system where the KeplerAgent processes various inputs (numerical data, trajectory plots, and a spiral pattern) to generate mathematical models. The equations likely describe the motion or behavior of a system, possibly related to orbital mechanics or a similar field. The use of Python and robotics icons suggests that the KeplerAgent is a software tool used for simulation, analysis, or control of a physical system. The spiral pattern input could represent a potential field or some other spatial distribution influencing the system's behavior. The data table provides initial conditions or parameters for the system being modeled.