## Diagram: KeplerAgent System Overview
### Overview
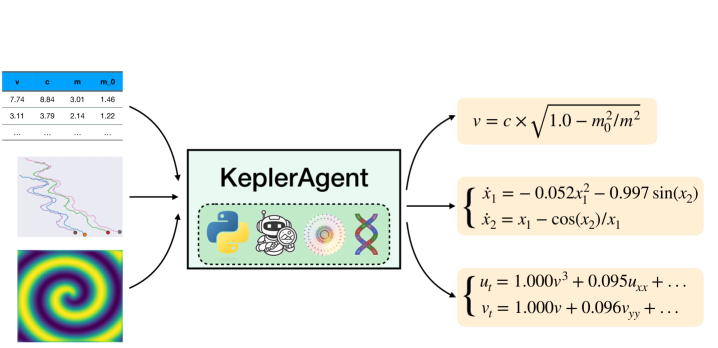
The image depicts a diagram illustrating the KeplerAgent system, showing its inputs and outputs. The central element is a rectangular box labeled "KeplerAgent" containing icons representing Python, a robot head, a DNA helix, and a grid. Four inputs are shown as images connected to the KeplerAgent box via curved arrows. Three outputs are shown as equations connected to the KeplerAgent box via curved arrows. A small data table is positioned in the top-left corner.
### Components/Axes
* **Central Element:** "KeplerAgent" (rectangular box, light green fill)
* **Inputs (Left Side):**
* Top-Left: Data Table with columns labeled "c", "m", "m₀"
* Middle-Left: A plot of a winding line with colored points.
* Bottom-Left: A spiral heatmap.
* **Outputs (Right Side):**
* Top-Right: Equation: v = c × √(1.0 - m₀²/m²)
* Middle-Right: System of Equations:
* x₁ = -0.052x₁² - 0.997 sin(x₂)
* x₂ = x₁ - cos(x₂)/x₁
* Bottom-Right: System of Equations:
* uᵣ = 1.000v³ + 0.095uₓ + ...
* vᵣ = 1.000v + 0.096vᵣ + ...
* **Icons within KeplerAgent:** Python logo, robot head, DNA helix, grid pattern.
* **Data Table Headers:** c, m, m₀
### Detailed Analysis or Content Details
* **Data Table:**
* Row 1: c = 7.74, m = 8.84, m₀ = 1.46
* Row 2: c = 3.11, m = 3.79, m₀ = 1.22
* Row 3: "..." (indicating more data)
* **Equation 1 (Top-Right):** v = c × √(1.0 - m₀²/m²)
* This equation relates variables v, c, m, and m₀.
* **Equation 2 (Middle-Right):**
* x₁ = -0.052x₁² - 0.997 sin(x₂)
* x₂ = x₁ - cos(x₂)/x₁
* This is a system of two equations relating x₁ and x₂.
* **Equation 3 (Bottom-Right):**
* uᵣ = 1.000v³ + 0.095uₓ + ...
* vᵣ = 1.000v + 0.096vᵣ + ...
* This is a system of two equations relating uᵣ, vᵣ, v, and uₓ. The "..." indicates further terms.
* **Input Plot (Middle-Left):** The plot shows a winding line. The line starts in the bottom-left, curves upwards and to the right, and then loops back down. Colored points are scattered along the line. The colors appear to vary along the line's length.
* **Input Heatmap (Bottom-Left):** The heatmap displays a spiral pattern with a color gradient. The colors range from dark blue to yellow to red, forming a spiral shape.
### Key Observations
* The KeplerAgent appears to be a processing unit that takes multiple types of input (tabular data, a plot, and a heatmap) and produces mathematical equations as output.
* The equations suggest a physics or mathematical modeling context, potentially involving velocity (v), mass (m), and other related parameters.
* The icons within the KeplerAgent box suggest the use of Python programming, robotics, genetics (DNA), and potentially grid-based data structures.
* The "..." in the data table and equations indicate that the data or equations are incomplete or truncated.
### Interpretation
The diagram illustrates a system, KeplerAgent, that transforms diverse data inputs into mathematical representations. The inputs represent different data modalities – structured data (table), visual data (plot and heatmap). The outputs are equations, suggesting that KeplerAgent performs some form of modeling or analysis to derive these equations from the inputs. The presence of the Python logo and DNA helix suggests that the system may involve machine learning, genetic algorithms, or other computational techniques. The equations themselves hint at a physical or mathematical system being modeled, potentially related to motion or dynamics. The system appears to be designed to discover or approximate underlying mathematical relationships from complex data. The use of "..." suggests that the system is capable of handling more complex or higher-dimensional data than is shown in the diagram. The overall impression is of a sophisticated data analysis and modeling tool.