## Line Chart: Probe Accuracy
### Overview
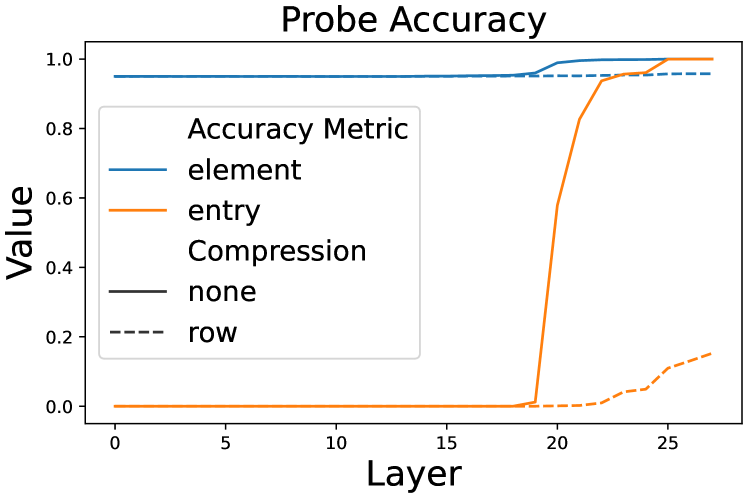
The image is a line chart titled "Probe Accuracy". It displays the accuracy of different metrics ("element", "entry", "none", and "row") across various layers. The x-axis represents the layer number, and the y-axis represents the value (accuracy).
### Components/Axes
* **Title:** Probe Accuracy
* **X-axis:** Layer, with markers from 0 to 25 in increments of 5.
* **Y-axis:** Value, with markers from 0.0 to 1.0 in increments of 0.2.
* **Legend (top-left):** Accuracy Metric
* element (solid teal line)
* entry (solid orange line)
* none (solid black line) - Note: This line is not visible on the chart, implying a constant value of 0 or near 0.
* row (dashed black line)
### Detailed Analysis
* **Element (solid teal line):** The accuracy starts at approximately 0.95 and remains relatively constant until layer 19, after which it increases slightly to approximately 0.99.
* Layer 0-19: Value ~ 0.95
* Layer 20-27: Value ~ 0.99
* **Entry (solid orange line):** The accuracy is at 0 until layer 19. Between layers 19 and 22, the accuracy increases sharply from 0 to approximately 0.9. After layer 22, the accuracy increases more gradually to approximately 0.97 by layer 27.
* Layer 0-19: Value = 0
* Layer 20: Value ~ 0.1
* Layer 21: Value ~ 0.6
* Layer 22: Value ~ 0.9
* Layer 27: Value ~ 0.97
* **None (solid black line):** This line is not visible, suggesting its value is consistently near 0 across all layers.
* **Row (dashed black line):** The accuracy is at 0 until layer 21. It then gradually increases to approximately 0.15 by layer 27.
* Layer 0-21: Value = 0
* Layer 27: Value ~ 0.15
### Key Observations
* The "element" metric has the highest and most stable accuracy across all layers.
* The "entry" metric experiences a significant increase in accuracy between layers 19 and 22.
* The "row" metric shows a gradual increase in accuracy starting from layer 21.
* The "none" metric has negligible accuracy across all layers.
### Interpretation
The chart compares the accuracy of different compression metrics ("element", "entry", "none", and "row") across different layers. The "element" metric consistently performs well, while the "entry" metric shows a delayed but significant increase in accuracy. The "row" metric shows a gradual improvement, and the "none" metric performs poorly. This suggests that the "element" metric is the most reliable for maintaining accuracy across layers, while the "entry" metric becomes more effective in later layers. The "none" metric is not effective for this task.