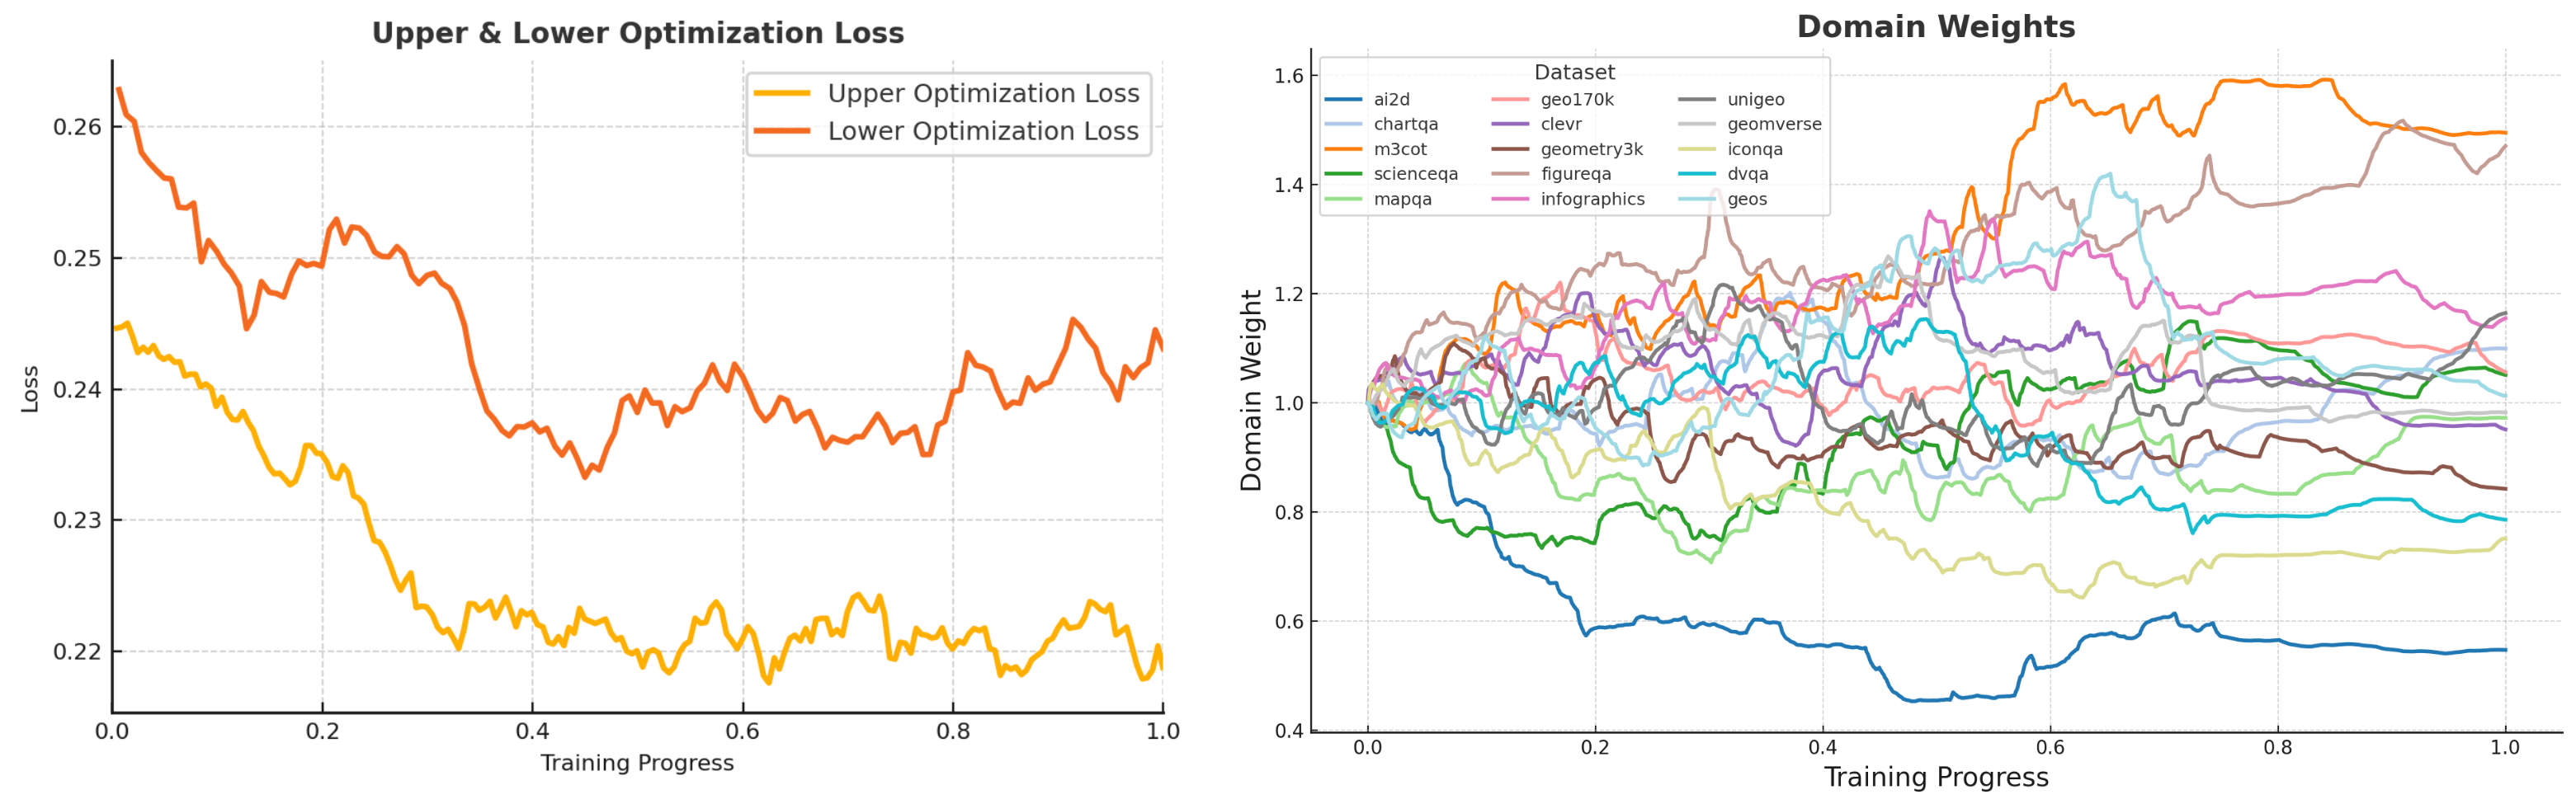
## Chart: Optimization Loss and Domain Weights During Training
### Overview
The image presents two line charts side-by-side. The left chart displays the "Upper & Lower Optimization Loss" as a function of "Training Progress". The right chart shows "Domain Weights" for various datasets, also plotted against "Training Progress". Both charts share the same x-axis, representing training progress from 0.0 to 1.0.
### Components/Axes
**Left Chart: Upper & Lower Optimization Loss**
* **Title:** Upper & Lower Optimization Loss
* **X-axis:** Training Progress, ranging from 0.0 to 1.0 in increments of 0.2.
* **Y-axis:** Loss, ranging from 0.22 to 0.26 in increments of 0.01.
* **Legend:** Located in the top-right corner.
* Orange line: Upper Optimization Loss
* Red line: Lower Optimization Loss
**Right Chart: Domain Weights**
* **Title:** Domain Weights
* **X-axis:** Training Progress, ranging from 0.0 to 1.0 in increments of 0.2.
* **Y-axis:** Domain Weight, ranging from 0.4 to 1.6 in increments of 0.2.
* **Legend:** Located in the top-left corner, listing the datasets and their corresponding line colors:
* Blue: ai2d
* Light Blue: chartqa
* Orange: m3cot
* Green: scienceqa
* Light Green: mapqa
* Gray: geo170k
* Light Gray: clevr
* Yellow: geometry3k
* Pink: figureqa
* Brown: infographics
* Light Pink: unigeo
* Purple: geomverse
* Teal: iconqa
* Cyan: dvqa
* Dark Green: geos
### Detailed Analysis
**Left Chart: Upper & Lower Optimization Loss**
* **Upper Optimization Loss (Orange):** Starts at approximately 0.245 at Training Progress 0.0, decreases to approximately 0.22 at Training Progress 0.4, and then fluctuates between 0.22 and 0.225 for the remainder of the training progress.
* **Lower Optimization Loss (Red):** Starts at approximately 0.265 at Training Progress 0.0, decreases to approximately 0.24 at Training Progress 0.4, and then fluctuates between 0.235 and 0.25 for the remainder of the training progress.
**Right Chart: Domain Weights**
* **ai2d (Blue):** Starts at 1.0, decreases sharply to approximately 0.45 by Training Progress 0.4, and then remains relatively stable around 0.5 for the rest of the training.
* **chartqa (Light Blue):** Starts at 1.0, increases to approximately 1.2 by Training Progress 0.4, and then fluctuates around 1.2 for the rest of the training.
* **m3cot (Orange):** Starts at 1.0, increases to approximately 1.6 by Training Progress 0.6, and then decreases slightly to approximately 1.55 for the rest of the training.
* **scienceqa (Green):** Starts at 1.0, decreases to approximately 0.75 by Training Progress 0.4, and then fluctuates around 0.8 for the rest of the training.
* **mapqa (Light Green):** Starts at 1.0, decreases to approximately 0.8 by Training Progress 0.2, and then fluctuates around 0.8 for the rest of the training.
* **geo170k (Gray):** Starts at 1.0, increases to approximately 1.2 by Training Progress 0.4, and then fluctuates around 1.1 for the rest of the training.
* **clevr (Light Gray):** Starts at 1.0, increases to approximately 1.2 by Training Progress 0.4, and then fluctuates around 1.1 for the rest of the training.
* **geometry3k (Yellow):** Starts at 1.0, increases to approximately 1.1 by Training Progress 0.2, and then fluctuates around 1.0 for the rest of the training.
* **figureqa (Pink):** Starts at 1.0, increases to approximately 1.2 by Training Progress 0.4, and then fluctuates around 1.1 for the rest of the training.
* **infographics (Brown):** Starts at 1.0, increases to approximately 1.1 by Training Progress 0.2, and then fluctuates around 1.0 for the rest of the training.
* **unigeo (Light Pink):** Starts at 1.0, increases to approximately 1.5 by Training Progress 0.6, and then fluctuates around 1.5 for the rest of the training.
* **geomverse (Purple):** Starts at 1.0, increases to approximately 1.2 by Training Progress 0.4, and then fluctuates around 1.1 for the rest of the training.
* **iconqa (Teal):** Starts at 1.0, increases to approximately 1.2 by Training Progress 0.4, and then fluctuates around 1.1 for the rest of the training.
* **dvqa (Cyan):** Starts at 1.0, increases to approximately 1.2 by Training Progress 0.4, and then fluctuates around 1.1 for the rest of the training.
* **geos (Dark Green):** Starts at 1.0, increases to approximately 1.2 by Training Progress 0.4, and then fluctuates around 1.1 for the rest of the training.
### Key Observations
* The Upper and Lower Optimization Losses both decrease during the initial phase of training and then stabilize.
* The Domain Weights for different datasets exhibit varying trends. Some datasets, like "ai2d", experience a decrease in weight, while others, like "m3cot" and "unigeo", show a significant increase. Most datasets converge to a weight around 1.0-1.2.
### Interpretation
The charts provide insights into the training dynamics of a model across different datasets. The decreasing optimization losses suggest that the model is learning and improving its performance as training progresses. The varying domain weights indicate that the model is adapting its focus to different datasets during training. The "ai2d" dataset seems to be less important for the model, as its weight decreases significantly, while "m3cot" and "unigeo" become more important. The stabilization of most domain weights around 1.0-1.2 suggests that the model eventually balances its attention across these datasets.