## Line Charts: Upper & Lower Optimization Loss vs Domain Weights
### Overview
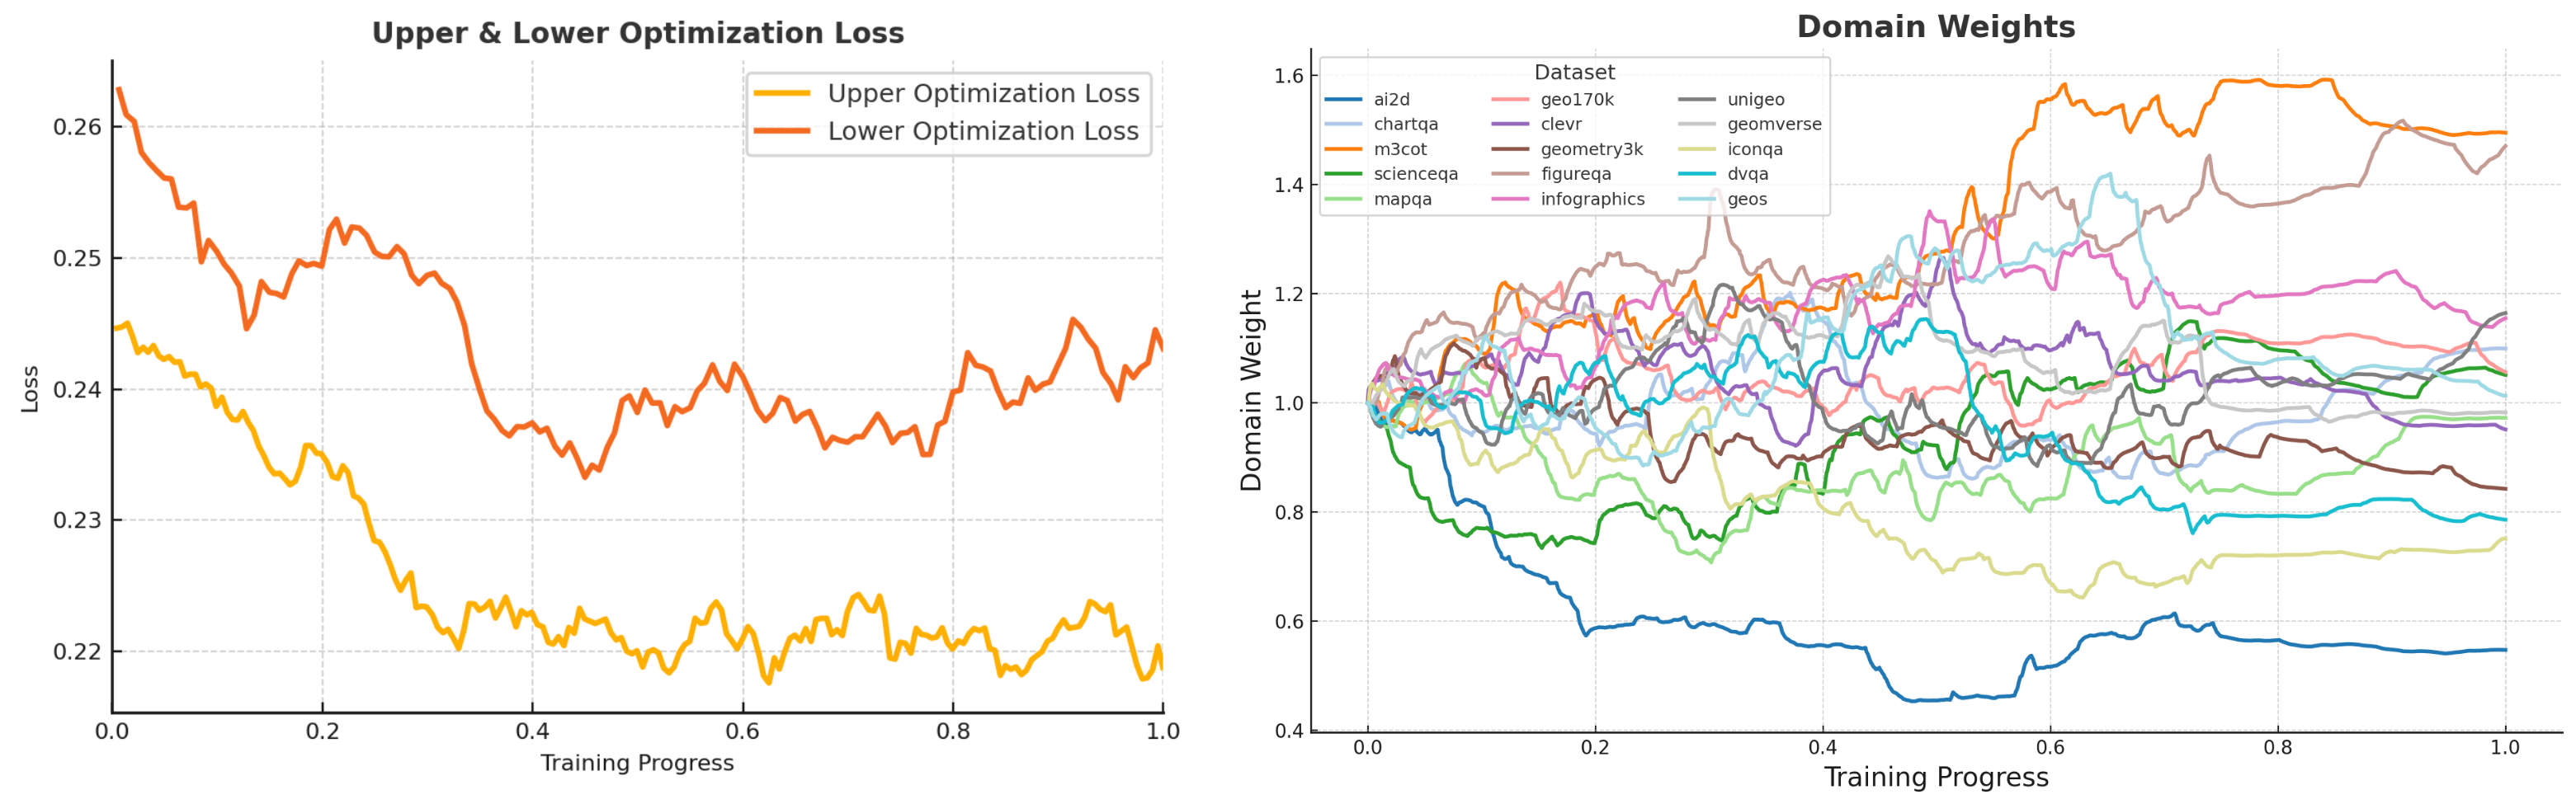
The image contains two side-by-side line charts tracking optimization metrics during training progress. The left chart shows optimization loss trends, while the right chart displays domain weight variations across multiple datasets.
### Components/Axes
**Left Chart ("Upper & Lower Optimization Loss"):**
- **X-axis**: Training Progress (0.0 to 1.0 in 0.1 increments)
- **Y-axis**: Loss (0.22 to 0.26 in 0.01 increments)
- **Legend**:
- Yellow: Upper Optimization Loss
- Red: Lower Optimization Loss
- **Legend Position**: Top-right corner
**Right Chart ("Domain Weights"):**
- **X-axis**: Training Progress (0.0 to 1.0 in 0.1 increments)
- **Y-axis**: Domain Weight (0.4 to 1.6 in 0.2 increments)
- **Legend**: 12 datasets with unique colors (ai2d, chartqa, clevr, etc.)
- **Legend Position**: Right side of chart
### Detailed Analysis
**Left Chart Trends:**
1. **Upper Optimization Loss (Yellow)**:
- Starts at ~0.245 at 0.0 training progress
- Decreases steadily to ~0.218 by 0.3 training progress
- Fluctuates between 0.218-0.225 for remaining progress
- Final value: ~0.219 at 1.0 training progress
2. **Lower Optimization Loss (Red)**:
- Starts at ~0.265 at 0.0 training progress
- Decreases to ~0.235 by 0.3 training progress
- Shows significant volatility between 0.3-0.8 training progress
- Final value: ~0.242 at 1.0 training progress
**Right Chart Trends (Domain Weights):**
1. **ai2d (Blue)**: Sharp initial drop from 1.0 to 0.6, then stabilizes at ~0.6
2. **m3cot (Orange)**: Gradual rise from 1.0 to 1.5, then stabilizes
3. **clevr (Purple)**: Moderate fluctuations between 1.0-1.2
4. **geometry3k (Brown)**: Stable at ~1.1 throughout
5. **scienceqa (Green)**: Sharp drop to 0.8, then gradual recovery
6. **figureqa (Gray)**: Stable at ~1.3
7. **unigeo (Yellow)**: Sharp rise to 1.5, then decline to 1.3
8. **geomverse (Pink)**: Gradual increase to 1.4
9. **iconqa (Light Blue)**: Stable at ~1.1
10. **dvqa (Cyan)**: Moderate fluctuations between 1.0-1.2
11. **geos (Light Green)**: Stable at ~1.0
12. **mapqa (Dark Green)**: Gradual decline from 1.2 to 0.9
### Key Observations
1. Upper optimization loss shows more stable convergence than lower loss
2. Domain weights exhibit diverse behaviors:
- Some datasets (ai2d, scienceqa) show significant early changes
- Others (geometry3k, geos) remain relatively stable
3. Lower optimization loss volatility correlates with domain weight fluctuations in multiple datasets
4. Final domain weights cluster between 0.8-1.5, with m3cot and unigeo reaching highest values
### Interpretation
The charts suggest a complex relationship between domain weights and optimization performance:
1. **Stable Domain Weights** (geometry3k, geos) correlate with more predictable optimization loss patterns
2. **Volatile Domain Weights** (unigeo, scienceqa) show stronger correlation with lower optimization loss fluctuations
3. The persistent gap between upper and lower loss values (0.02-0.03 range) indicates potential optimization challenges in the lower bound
4. The divergence between domain weight trends and optimization outcomes suggests dataset-specific optimization requirements
5. The final optimization loss values (~0.219 upper, ~0.242 lower) indicate room for improvement in lower bound optimization
The data implies that domain weight management significantly impacts optimization stability, with different datasets requiring distinct weight adjustment strategies for optimal performance.