## Line Graph: Cross-Entropy vs. Focal Loss with Varying Gamma Values
### Overview
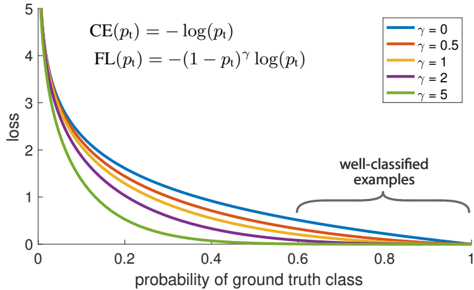
The graph compares two loss functions—Cross-Entropy (CE) and Focal Loss (FL)—across different gamma (γ) values. The x-axis represents the "probability of ground truth class" (p_t), ranging from 0 to 1, while the y-axis shows the loss magnitude (0 to 5). Five curves are plotted, each corresponding to a γ value (0, 0.5, 1, 2, 5), with annotations for well-classified examples (p_t > 0.8).
### Components/Axes
- **X-axis**: "probability of ground truth class" (0 to 1, linear scale).
- **Y-axis**: "loss" (0 to 5, linear scale).
- **Legend**: Located in the top-right corner, mapping γ values to colors:
- γ = 0 (blue)
- γ = 0.5 (orange)
- γ = 1 (yellow)
- γ = 2 (purple)
- γ = 5 (green)
- **Equations**:
- CE(p_t) = -log(p_t)
- FL(p_t) = -(1 - p_t)^γ log(p_t)
- **Annotation**: A shaded region labeled "well-classified examples" spans p_t = 0.8 to 1.0.
### Detailed Analysis
1. **Cross-Entropy (CE) Loss**:
- Represented by the blue line (γ = 0).
- Equation: CE(p_t) = -log(p_t).
- Behavior: Steeply decreasing as p_t increases, with a sharp drop near p_t = 0.
2. **Focal Loss (FL) Curves**:
- **γ = 0.5 (orange)**: Slightly flatter than CE near p_t = 1, but steeper near p_t = 0.
- **γ = 1 (yellow)**: Balanced trade-off; less steep than γ = 0.5 near p_t = 1.
- **γ = 2 (purple)**: Flatter near p_t = 1, emphasizing well-classified examples.
- **γ = 5 (green)**: Nearly flat near p_t = 1, minimizing loss for high-confidence predictions.
3. **Key Trends**:
- All FL curves converge to CE at p_t = 1 (loss = 0).
- Higher γ values reduce the loss gradient for well-classified examples (p_t > 0.8).
- At p_t = 0.5, FL loss decreases with increasing γ (e.g., γ = 5 has ~0.3 loss vs. γ = 0’s ~0.7).
### Key Observations
- **Well-Classified Examples**: The shaded region (p_t > 0.8) shows minimal loss across all γ values, with γ = 5 having the lowest loss.
- **Misclassified Examples**: At p_t = 0.2, γ = 5 produces the highest loss (~4.5), while γ = 0 matches CE (~1.6).
- **Gamma Sensitivity**: Higher γ values amplify the penalty for low-p_t predictions, prioritizing hard examples during training.
### Interpretation
The graph demonstrates how Focal Loss modulates the impact of misclassified vs. well-classified examples via γ. Lower γ values (e.g., 0.5) retain CE-like behavior, while higher γ (e.g., 5) suppresses loss for confident predictions, focusing training on uncertain samples. This trade-off is critical for imbalanced datasets, where overemphasizing easy examples can degrade model performance. The convergence of FL curves at p_t = 1 underscores its design to address class imbalance by down-weighting easy examples.