TECHNICAL ASSET FINGERPRINT
4ecae2b28f4a741aa6d85067
Click to view fullscreen
Press ESC or click to close
FOUND IN PAPERS
EXPERT: gemma-3-27b-it-free VERSION 1
RUNTIME: google-free/gemma-3-27b-it
INTEL_VERIFIED
\n
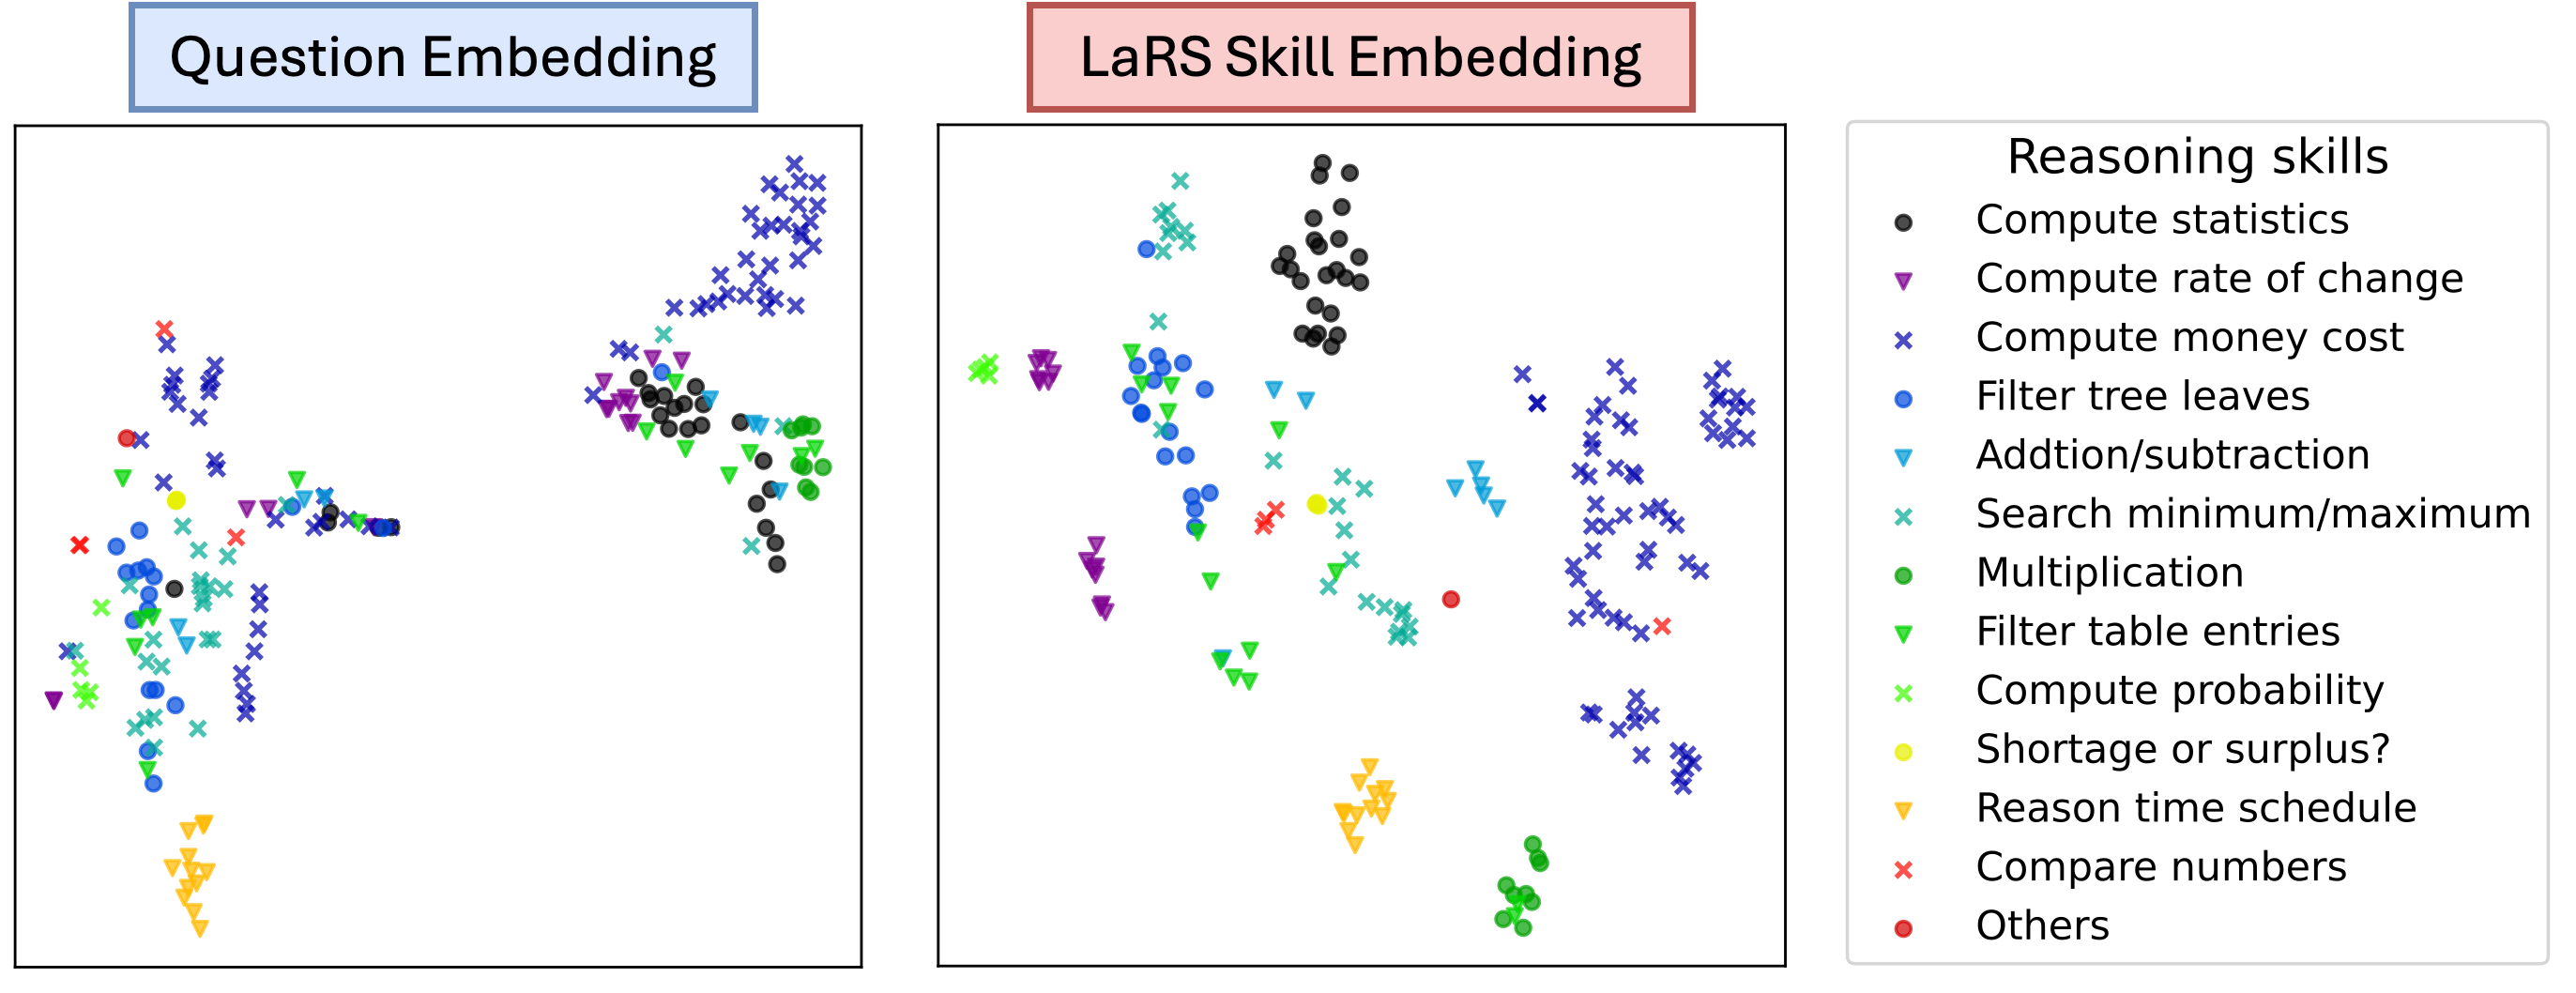
## Scatter Plots: Question Embedding vs. LaRS Skill Embedding
### Overview
The image presents two scatter plots side-by-side, labeled "Question Embedding" and "LaRS Skill Embedding". A legend on the right side associates different reasoning skills with distinct marker shapes and colors. The plots appear to visualize the relationship between question embeddings and the skills required to answer those questions.
### Components/Axes
The image consists of:
* **Two Scatter Plots:** Each plot has an implicit x and y axis, but no explicit labels are provided. The axes represent embedding dimensions.
* **Legend:** Located on the right side, it maps reasoning skills to marker types and colors.
* **Titles:** "Question Embedding" (top-left) and "LaRS Skill Embedding" (top-center).
The legend lists the following reasoning skills:
* Compute statistics (black circle)
* Compute rate of change (purple downward triangle)
* Compute money cost (blue 'x')
* Filter tree leaves (dark grey circle)
* Addition/subtraction (purple square)
* Search minimum/maximum (green 'x')
* Multiplication (green circle)
* Filter table entries (teal downward triangle)
* Compute probability (light green 'x')
* Shortage or surplus? (orange downward triangle)
* Reason time schedule (orange triangle)
* Compare numbers (red circle)
* Others (red circle)
### Detailed Analysis or Content Details
**Question Embedding Plot (Left):**
This plot displays a dense scattering of points.
* **Red Circles (Compare numbers):** Scattered throughout, with a concentration in the bottom-left quadrant. Approximately 10-15 points.
* **Blue 'x' (Compute money cost):** Concentrated in the top-left quadrant. Approximately 15-20 points.
* **Green 'x' (Search minimum/maximum):** Scattered throughout, with a moderate density. Approximately 10-15 points.
* **Purple Downward Triangles (Compute rate of change):** Concentrated in the top-right quadrant. Approximately 5-10 points.
* **Orange Triangles (Reason time schedule):** Concentrated in the bottom-right quadrant. Approximately 5-10 points.
* **Green Circles (Multiplication):** Scattered throughout, with a moderate density. Approximately 5-10 points.
* **Purple Squares (Addition/subtraction):** Scattered throughout, with a moderate density. Approximately 5-10 points.
* **Dark Grey Circles (Filter tree leaves):** Scattered throughout, with a moderate density. Approximately 5-10 points.
* **Teal Downward Triangles (Filter table entries):** Scattered throughout, with a moderate density. Approximately 5-10 points.
* **Light Green 'x' (Compute probability):** Scattered throughout, with a moderate density. Approximately 5-10 points.
* **Orange Downward Triangles (Shortage or surplus?):** Scattered throughout, with a moderate density. Approximately 5-10 points.
* **Black Circles (Compute statistics):** Scattered throughout, with a moderate density. Approximately 10-15 points.
**LaRS Skill Embedding Plot (Right):**
This plot also displays a dense scattering of points, but with a different distribution compared to the left plot.
* **Black Circles (Compute statistics):** Dominant in the center of the plot. Approximately 20-25 points.
* **Blue 'x' (Compute money cost):** Scattered throughout, with a moderate density. Approximately 10-15 points.
* **Red Circles (Compare numbers):** Scattered throughout, with a moderate density. Approximately 5-10 points.
* **Purple Downward Triangles (Compute rate of change):** Scattered throughout, with a moderate density. Approximately 5-10 points.
* **Green 'x' (Search minimum/maximum):** Scattered throughout, with a moderate density. Approximately 5-10 points.
* **Purple Squares (Addition/subtraction):** Scattered throughout, with a moderate density. Approximately 5-10 points.
* **Green Circles (Multiplication):** Scattered throughout, with a moderate density. Approximately 5-10 points.
* **Teal Downward Triangles (Filter table entries):** Scattered throughout, with a moderate density. Approximately 5-10 points.
* **Light Green 'x' (Compute probability):** Scattered throughout, with a moderate density. Approximately 5-10 points.
* **Orange Downward Triangles (Shortage or surplus?):** Scattered throughout, with a moderate density. Approximately 5-10 points.
* **Orange Triangles (Reason time schedule):** Scattered throughout, with a moderate density. Approximately 5-10 points.
* **Dark Grey Circles (Filter tree leaves):** Scattered throughout, with a moderate density. Approximately 5-10 points.
### Key Observations
* The "LaRS Skill Embedding" plot shows a strong concentration of "Compute statistics" points in the center, suggesting this skill is central to the LaRS skill space.
* The "Question Embedding" plot shows a more dispersed distribution of skills, indicating a wider range of skills are required to answer questions.
* "Compute money cost" appears to be more prominent in the "Question Embedding" plot than in the "LaRS Skill Embedding" plot.
* The plots do not have explicit axes, making it difficult to determine precise relationships between embedding dimensions and skills.
### Interpretation
The image suggests a mapping between questions and the reasoning skills needed to solve them. The "Question Embedding" plot represents questions in a high-dimensional space, where the position of each point is determined by its embedding. The "LaRS Skill Embedding" plot represents the skills required to answer those questions, also in a high-dimensional space.
The different marker shapes and colors represent different reasoning skills. By comparing the distributions of skills in the two plots, we can gain insights into the types of skills that are most commonly required to answer questions.
The concentration of "Compute statistics" in the "LaRS Skill Embedding" plot suggests that this skill is fundamental to the LaRS framework. The more dispersed distribution of skills in the "Question Embedding" plot indicates that questions often require a combination of different reasoning skills.
The lack of axis labels limits the depth of analysis. Without knowing what the axes represent, it is difficult to draw definitive conclusions about the relationships between embedding dimensions and skills. However, the visual patterns in the plots provide valuable qualitative insights into the nature of question answering and the role of reasoning skills.
DECODING INTELLIGENCE...