TECHNICAL ASSET FINGERPRINT
4ecae2b28f4a741aa6d85067
Click to view fullscreen
Press ESC or click to close
FOUND IN PAPERS
EXPERT: healer-alpha-free VERSION 1
RUNTIME: free/openrouter/healer-alpha
INTEL_VERIFIED
## Scatter Plot Comparison: Question Embedding vs. LaRS Skill Embedding
### Overview
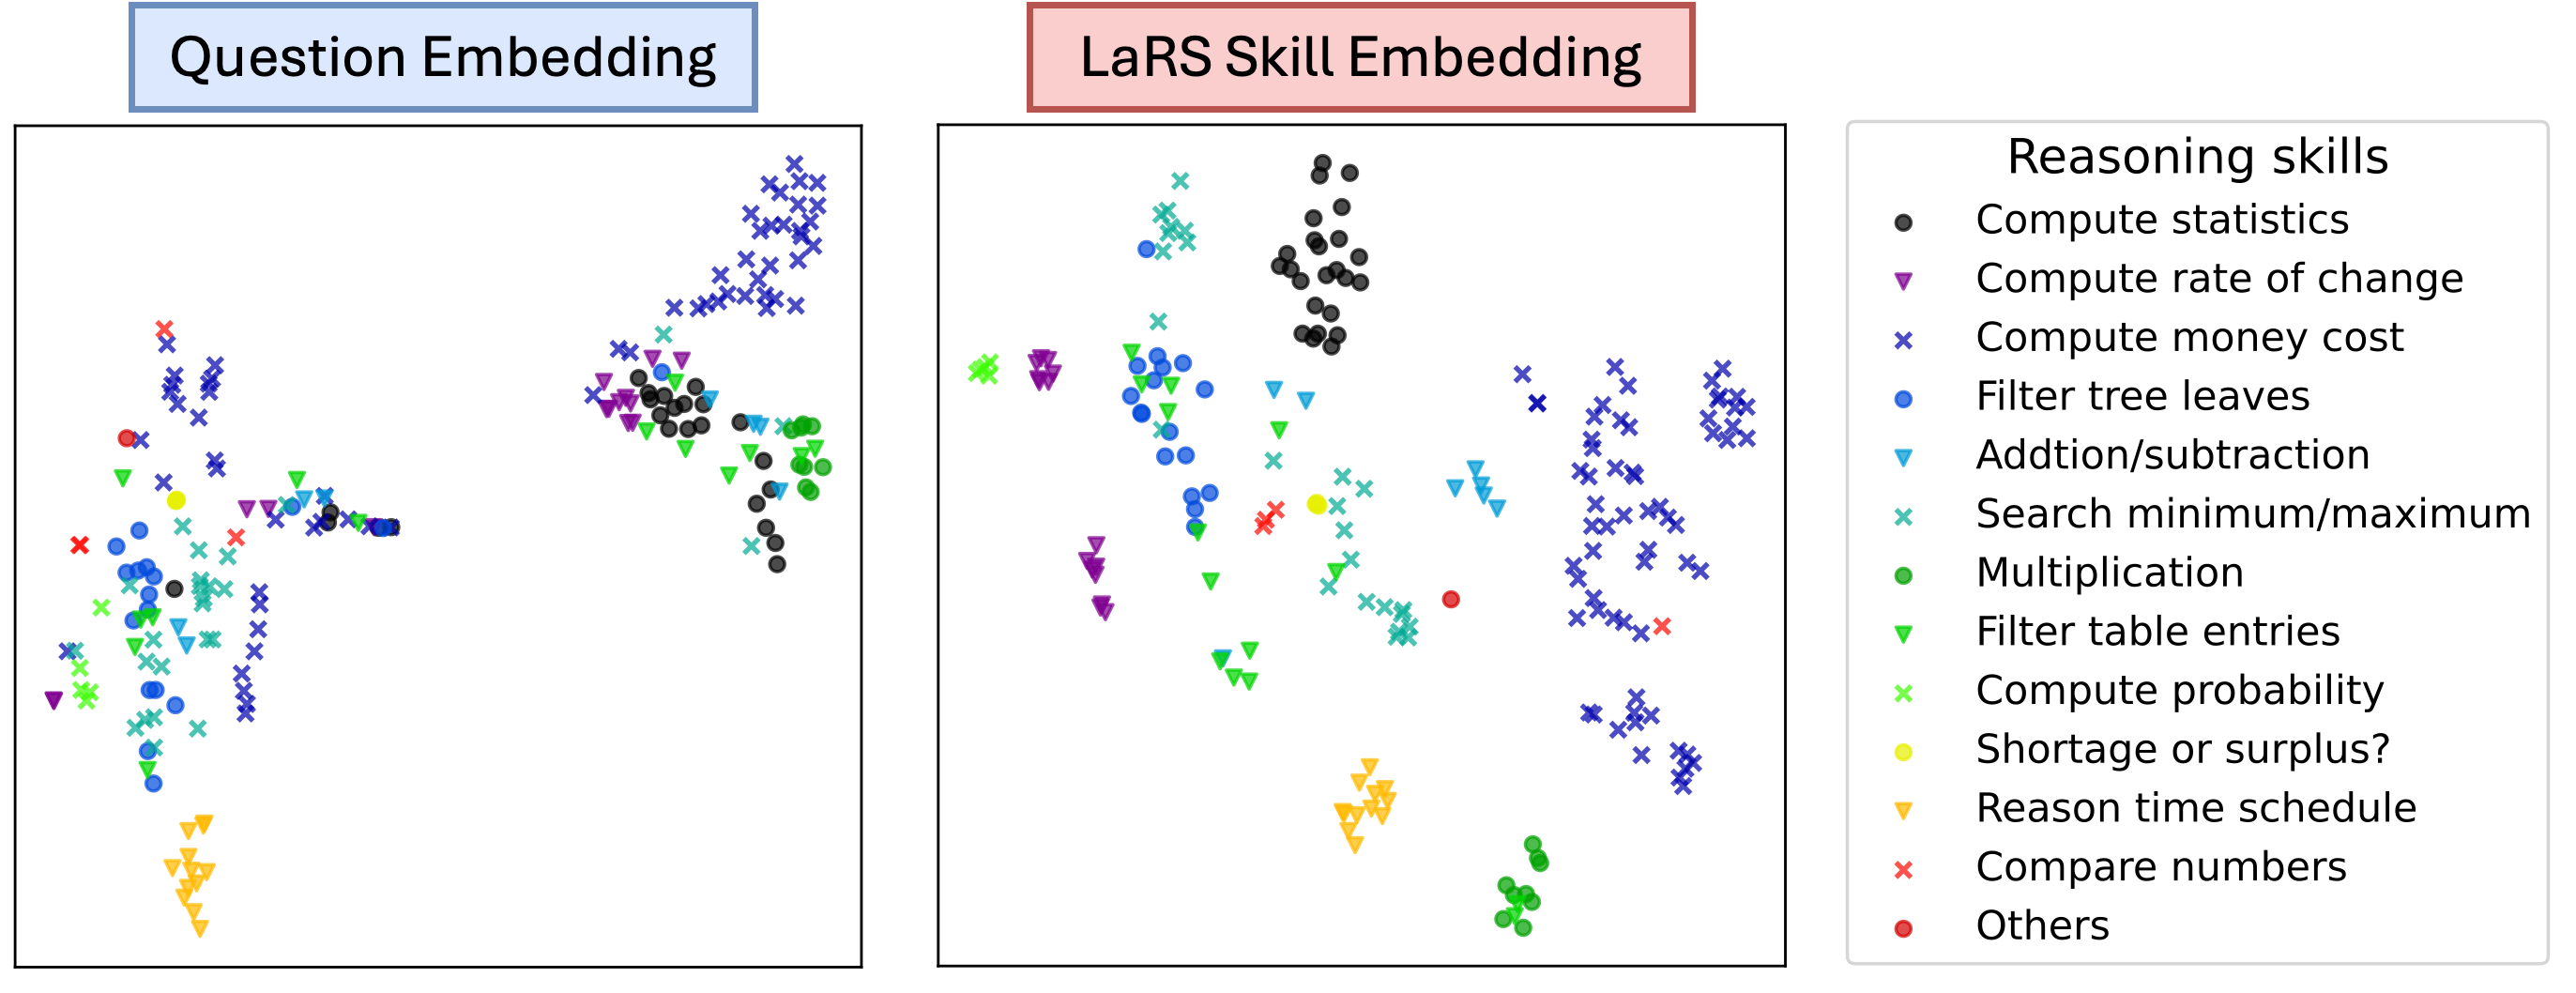
The image displays two side-by-side scatter plots visualizing data points in a two-dimensional space, accompanied by a comprehensive legend. The plots compare the embedding representations of "Questions" (left) and "LaRS Skills" (right). Each data point is a colored symbol representing a specific "Reasoning skill." The visualization aims to show how questions and skills cluster based on their semantic or functional similarity in the embedding space.
### Components/Axes
* **Titles:**
* Left Plot: "Question Embedding" (blue header box).
* Right Plot: "LaRS Skill Embedding" (red header box).
* **Legend (Right Panel):** Titled "Reasoning skills". It lists 13 distinct categories, each with a unique symbol and color combination.
* **Axes:** The plots are unlabeled 2D scatter plots. No axis titles, scales, or numerical markers are present. The spatial arrangement represents relative similarity in the embedding space.
* **Data Series (from Legend):**
1. **Compute statistics:** Black circle (●)
2. **Compute rate of change:** Purple downward triangle (▼)
3. **Compute money cost:** Blue 'x' (×)
4. **Filter tree leaves:** Blue circle (●)
5. **Addtion/subtraction:** Light blue downward triangle (▼) *[Note: "Addtion" is a typo in the source image]*
6. **Search minimum/maximum:** Teal 'x' (×)
7. **Multiplication:** Green circle (●)
8. **Filter table entries:** Green downward triangle (▼)
9. **Compute probability:** Light green 'x' (×)
10. **Shortage or surplus?:** Yellow circle (●)
11. **Reason time schedule:** Orange downward triangle (▼)
12. **Compare numbers:** Red 'x' (×)
13. **Others:** Red circle (●)
### Detailed Analysis
**1. Question Embedding Plot (Left):**
* **Spatial Distribution:** Shows two primary, distinct clusters.
* **Left Cluster:** A dense, vertically oriented cluster on the left side of the plot. It contains a high mixture of symbols, including blue circles ("Filter tree leaves"), light blue triangles ("Addtion/subtraction"), teal 'x's ("Search minimum/maximum"), green triangles ("Filter table entries"), and purple triangles ("Compute rate of change"). Black circles ("Compute statistics") are also present within this mix.
* **Right Cluster:** A separate, more horizontally oriented cluster on the right side. This cluster is heavily dominated by blue 'x's ("Compute money cost"). It also contains a sub-cluster of black circles ("Compute statistics") and some purple triangles ("Compute rate of change").
* **Outliers/Isolated Points:** A small, tight cluster of orange triangles ("Reason time schedule") is located at the bottom-left, separate from the main left cluster. A few red 'x's ("Compare numbers") and red circles ("Others") are scattered sparsely.
**2. LaRS Skill Embedding Plot (Right):**
* **Spatial Distribution:** Shows more dispersed and separated clusters compared to the Question plot.
* **Top-Center:** A distinct cluster of black circles ("Compute statistics").
* **Top-Left:** A cluster of teal 'x's ("Search minimum/maximum").
* **Center-Left:** A cluster of blue circles ("Filter tree leaves") mixed with some light blue triangles ("Addtion/subtraction").
* **Center:** A loose grouping containing light green 'x's ("Compute probability"), a yellow circle ("Shortage or surplus?"), and a red circle ("Others").
* **Right Side:** A large, dispersed cloud of blue 'x's ("Compute money cost").
* **Bottom-Right:** A small, tight cluster of green circles ("Multiplication").
* **Bottom-Center:** A distinct cluster of orange triangles ("Reason time schedule").
* **Left Side:** Scattered purple triangles ("Compute rate of change") and green triangles ("Filter table entries").
* **Outliers/Isolated Points:** A single red 'x' ("Compare numbers") is isolated near the center-right. A few light blue triangles ("Addtion/subtraction") are scattered near the center.
### Key Observations
1. **Clustering by Skill Type:** In both plots, points of the same color/symbol (same skill) tend to cluster together, indicating the embeddings capture skill-specific features.
2. **Increased Separation in Skill Embedding:** The "LaRS Skill Embedding" plot shows clearer separation between clusters of different skills (e.g., "Compute statistics" vs. "Compute money cost") compared to the more mixed "Question Embedding" plot.
3. **Dominant Skill in Questions:** The "Compute money cost" skill (blue 'x') forms a very prominent and separate cluster in the Question Embedding, suggesting many questions in the dataset require this specific skill.
4. **Skill Proximity:** In the Question Embedding, skills like "Filter tree leaves," "Addtion/subtraction," and "Search minimum/maximum" are intermingled, suggesting questions requiring these skills share similar embedding characteristics. In the Skill Embedding, they are more distinct.
5. **Consistent Outliers:** The "Reason time schedule" (orange ▼) and "Compare numbers" (red ×) skills form small, isolated clusters in both visualizations, indicating they are distinct from the more common skill groupings.
### Interpretation
This visualization demonstrates the effectiveness of the "LaRS" model in learning distinct, separable representations for different reasoning skills. The "Question Embedding" plot likely shows how raw questions map into this skill space; the mixing indicates that a single question may involve or be similar to multiple skills, or that the question representation is less refined. The clearer clustering in the "LaRS Skill Embedding" plot suggests the model has successfully disentangled these skills into dedicated regions of the embedding space.
The prominence of the "Compute money cost" cluster in the Question plot implies a significant portion of the evaluation dataset involves financial reasoning. The proximity of computational and filtering skills in the Question plot may reflect their frequent co-occurrence in multi-step reasoning problems. The isolation of skills like "Reason time schedule" suggests they involve unique semantic or structural features not strongly shared with other skill types. Overall, the plots provide visual evidence that the LaRS model's skill embeddings are semantically meaningful and can be used to analyze the composition of reasoning tasks.
DECODING INTELLIGENCE...