## Scatter Plots: Question Embedding vs LaRS Skill Embedding
### Overview
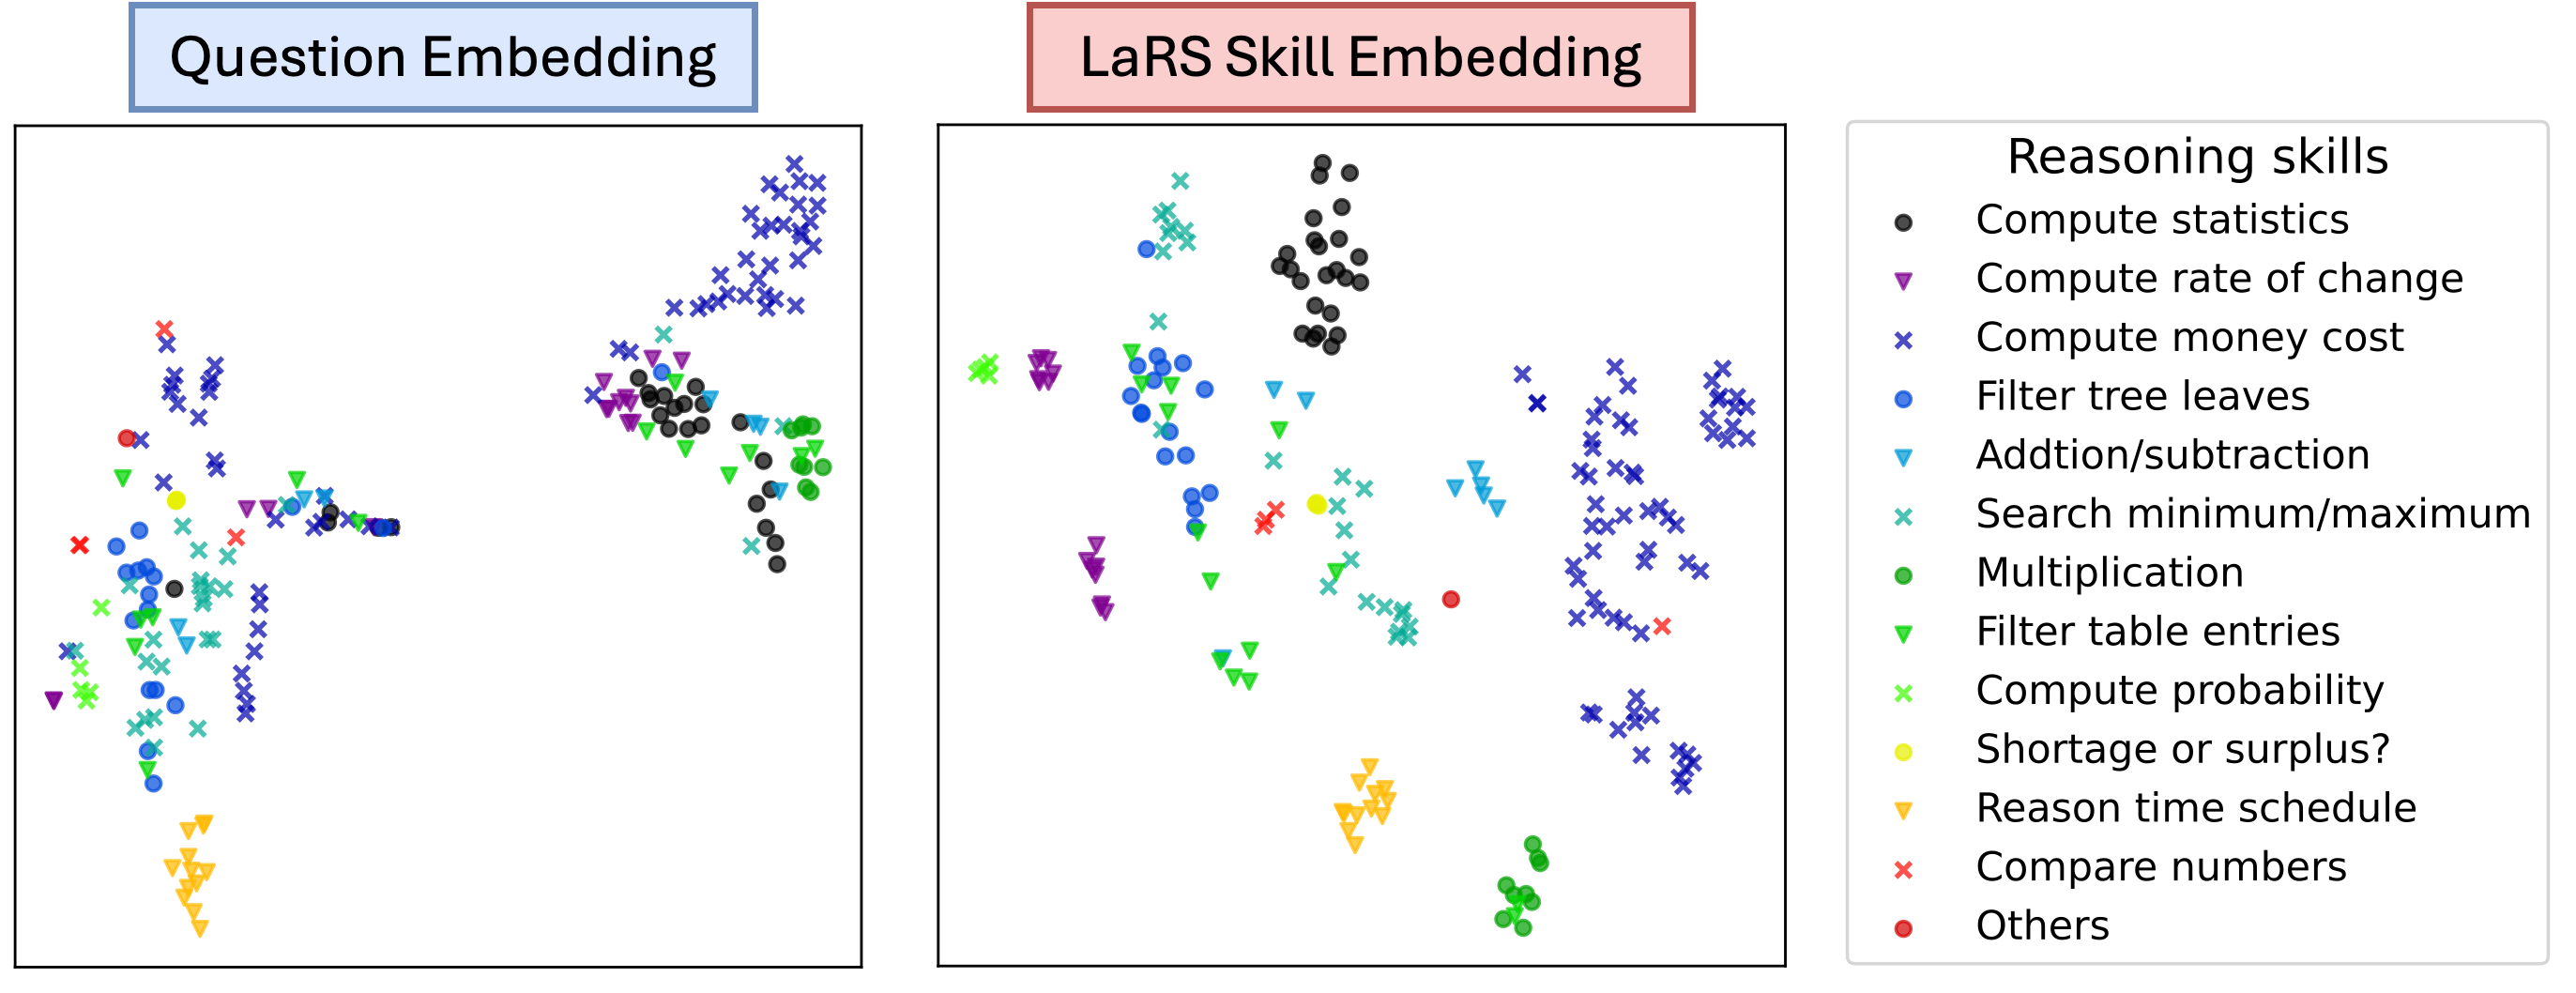
The image contains two side-by-side scatter plots comparing embeddings for reasoning skills. The left plot is labeled "Question Embedding," and the right is labeled "LaRS Skill Embedding." Both plots use colored geometric shapes (circles, triangles, crosses) to represent different reasoning skills, as defined in a legend on the right.
### Components/Axes
- **Legend**:
- **Black circles**: Compute statistics
- **Purple triangles**: Compute rate of change
- **Blue crosses**: Compute money cost
- **Cyan circles**: Filter tree leaves
- **Teal triangles**: Addition/subtraction
- **Green circles**: Multiplication
- **Teal triangles**: Filter table entries
- **Green crosses**: Compute probability
- **Yellow circles**: Shortage or surplus?
- **Orange triangles**: Reason time schedule
- **Red crosses**: Compare numbers
- **Red circles**: Others
- **Axes**:
- No explicit axis labels or scales are visible.
- X and Y axes are unlabeled, but data points are distributed across the plot area.
### Detailed Analysis
#### Question Embedding (Left Plot)
- **Compute statistics** (black circles): Clustered in the top-right quadrant.
- **Compute rate of change** (purple triangles): Scattered in the middle-left.
- **Compute money cost** (blue crosses): Spread across the middle-right.
- **Filter tree leaves** (cyan circles): Concentrated in the bottom-left.
- **Addition/subtraction** (teal triangles): Clustered in the top-center.
- **Multiplication** (green circles): Scattered in the middle-right.
- **Filter table entries** (teal triangles): Overlapping with "Addition/subtraction" in the top-center.
- **Compute probability** (green crosses): Located in the bottom-right.
- **Shortage or surplus?** (yellow circles): Clustered in the bottom-left.
- **Reason time schedule** (orange triangles): Spread across the bottom-center.
- **Compare numbers** (red crosses): Scattered in the top-left.
- **Others** (red circles): Concentrated in the bottom-left.
#### LaRS Skill Embedding (Right Plot)
- **Compute statistics** (black circles): Clustered in the top-right.
- **Compute rate of change** (purple triangles): Scattered in the middle-left.
- **Compute money cost** (blue crosses): Spread across the middle-right.
- **Filter tree leaves** (cyan circles): Concentrated in the bottom-left.
- **Addition/subtraction** (teal triangles): Clustered in the top-center.
- **Multiplication** (green circles): Scattered in the middle-right.
- **Filter table entries** (teal triangles): Overlapping with "Addition/subtraction" in the top-center.
- **Compute probability** (green crosses): Located in the bottom-right.
- **Shortage or surplus?** (yellow circles): Clustered in the bottom-left.
- **Reason time schedule** (orange triangles): Spread across the bottom-center.
- **Compare numbers** (red crosses): Scattered in the top-left.
- **Others** (red circles): Concentrated in the bottom-left.
### Key Observations
1. **Consistent Clustering**: Skills like "Compute statistics" (black circles) and "Others" (red circles) occupy similar positions in both plots, suggesting stable embeddings across methods.
2. **Overlap**: Some skills (e.g., "Addition/subtraction" and "Filter table entries") share regions in both plots, indicating potential semantic similarity.
3. **Anomalies**: "Compute probability" (green crosses) appears in the bottom-right in both plots, which may reflect lower frequency or distinctiveness in the dataset.
4. **Spatial Patterns**: Skills like "Shortage or surplus?" (yellow circles) and "Reason time schedule" (orange triangles) are consistently in the bottom-left, possibly indicating lower importance or less frequent occurrence.
### Interpretation
The embeddings effectively group similar reasoning skills, as evidenced by overlapping clusters in both plots. The consistent placement of "Others" (red circles) in the bottom-left suggests these skills are less distinct or less frequently represented in the data. The separation of "Compute statistics" (top-right) and "Filter tree leaves" (bottom-left) highlights differences in how these skills are encoded. The LaRS Skill Embedding plot mirrors the Question Embedding plot, implying that both methods capture similar semantic relationships. However, minor variations (e.g., "Compute probability" in the bottom-right) may reflect methodological differences in embedding generation. This visualization underscores the importance of embedding techniques in preserving skill relationships for applications like adaptive learning systems or skill-based assessments.