## Line Charts: Performance vs. Sample Size for Question Answering Models
### Overview
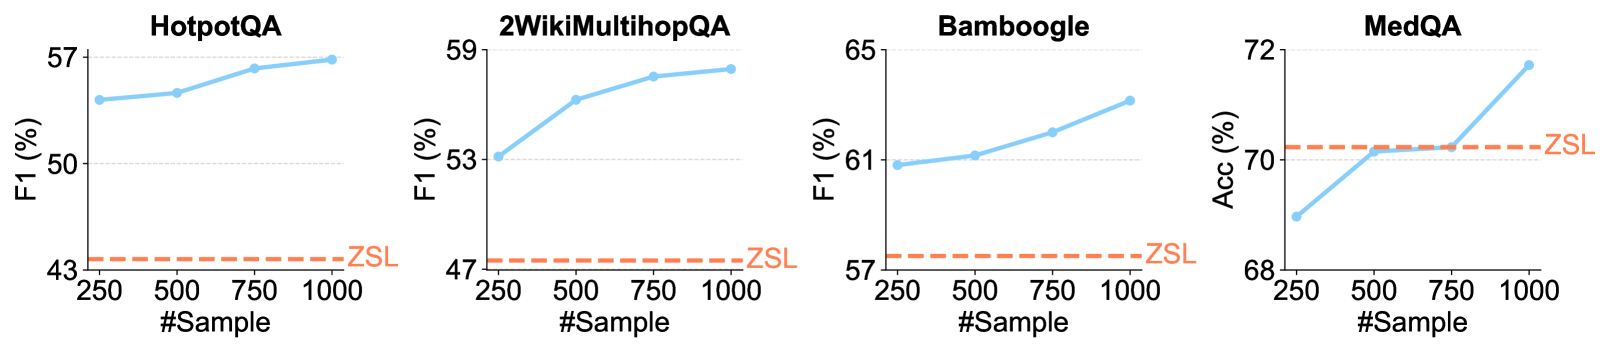
The image presents four separate line charts, each depicting the performance of a different question answering (QA) model (HotpotQA, 2WikiMultihopQA, Bamboogle, and MedQA) as a function of the number of training samples used. Performance is measured using either F1 score (for HotpotQA, 2WikiMultihopQA, and Bamboogle) or Accuracy (for MedQA). A dashed red line labeled "ZSL" represents a baseline performance level for each model.
### Components/Axes
Each chart shares the following components:
* **X-axis:** "#Sample" - Represents the number of training samples, ranging from 250 to 1000, with markers at 250, 500, 750, and 1000.
* **Y-axis:** Varies by chart:
* HotpotQA: "F1 (%)" - F1 score in percentage, ranging from approximately 43% to 57%.
* 2WikiMultihopQA: "F1 (%)" - F1 score in percentage, ranging from approximately 47% to 59%.
* Bamboogle: "F1 (%)" - F1 score in percentage, ranging from approximately 57% to 65%.
* MedQA: "Acc (%)" - Accuracy in percentage, ranging from approximately 68% to 72%.
* **Data Series:** A solid blue line representing the performance of the QA model.
* **Baseline:** A dashed red line labeled "ZSL" representing a zero-shot learning baseline.
* **Titles:** Each chart is labeled with the name of the corresponding QA model (HotpotQA, 2WikiMultihopQA, Bamboogle, MedQA).
### Detailed Analysis or Content Details
**HotpotQA:**
* The blue line starts at approximately 47% F1 score at 250 samples.
* It decreases slightly to around 44% at 500 samples.
* It then increases to approximately 52% at 750 samples.
* Finally, it reaches approximately 55% at 1000 samples.
* The ZSL baseline is consistently around 43%.
**2WikiMultihopQA:**
* The blue line begins at approximately 49% F1 score at 250 samples.
* It increases steadily to approximately 54% at 500 samples.
* It continues to rise to approximately 57% at 750 samples.
* It reaches approximately 58% at 1000 samples.
* The ZSL baseline is consistently around 47%.
**Bamboogle:**
* The blue line starts at approximately 60% F1 score at 250 samples.
* It increases to approximately 62% at 500 samples.
* It continues to rise to approximately 63% at 750 samples.
* It reaches approximately 65% at 1000 samples.
* The ZSL baseline is consistently around 57%.
**MedQA:**
* The blue line starts at approximately 69% Accuracy at 250 samples.
* It increases rapidly to approximately 71% at 500 samples.
* It continues to rise to approximately 71.5% at 750 samples.
* It reaches approximately 72% at 1000 samples.
* The ZSL baseline is consistently around 68%.
### Key Observations
* All four models show a general trend of increasing performance with an increasing number of training samples.
* MedQA exhibits the most significant performance improvement with increasing sample size, showing a steep upward slope.
* The ZSL baseline remains relatively constant across all models and sample sizes.
* HotpotQA shows a slight dip in performance between 250 and 500 samples, before recovering.
### Interpretation
The data suggests that increasing the amount of training data generally improves the performance of these question answering models. The magnitude of improvement varies between models, with MedQA benefiting the most from additional data. The consistent ZSL baseline indicates a level of performance achievable without any specific training data, likely due to inherent knowledge within the model or the ability to make reasonable guesses. The slight dip in HotpotQA's performance at 500 samples could be due to noise in the data or a temporary overfitting issue. Overall, the charts demonstrate the importance of data quantity in training effective question answering systems. The models are all performing above the ZSL baseline, indicating that training is beneficial. The differences in performance gains between models suggest varying degrees of data efficiency and model capacity.