## Diagram: Conceptual Relationship Model
### Overview
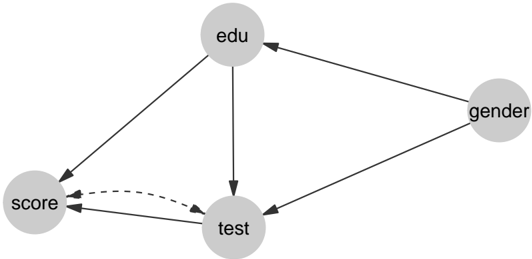
The image depicts a conceptual relationship diagram with four nodes connected by directional arrows. The nodes represent variables ("edu," "gender," "test," "score"), and the arrows indicate relationships or influences between them. One arrow is dashed, suggesting a weaker or indirect relationship.
### Components/Axes
- **Nodes**:
- `edu` (education)
- `gender`
- `test`
- `score`
- **Arrows**:
- Solid arrow from `edu` → `test`
- Solid arrow from `edu` → `gender`
- Solid arrow from `test` → `score`
- Dashed arrow from `score` → `test`
- Solid arrow from `gender` → `test`
### Detailed Analysis
- **Node Relationships**:
- `edu` directly influences both `test` and `gender`.
- `test` directly affects `score`.
- `score` has a feedback loop to `test` (dashed arrow), implying a potential cyclical relationship.
- `gender` influences `test`, suggesting a mediating or confounding factor.
### Key Observations
- The diagram emphasizes bidirectional influence between `test` and `score` (via the dashed arrow), which may indicate measurement error, iterative processes, or feedback mechanisms.
- `gender` acts as an external variable affecting `test`, potentially introducing bias or correlation.
- `edu` is positioned as a primary driver of both `test` and `gender`, suggesting foundational causality.
### Interpretation
This diagram likely models a causal or correlational framework in educational or social science research. The inclusion of `gender` as a node influencing `test` highlights potential equity considerations in testing outcomes. The feedback loop between `test` and `score` could represent adaptive learning systems or iterative assessment processes. The solid arrows from `edu` to `test` and `gender` imply that education is a root variable shaping both academic performance and demographic factors, though the latter relationship may require further contextualization (e.g., cultural or systemic influences). The dashed arrow introduces ambiguity, warranting clarification on whether it represents uncertainty, indirect effects, or non-linear dynamics.