## Causal Diagram: Education, Gender, Test Score
### Overview
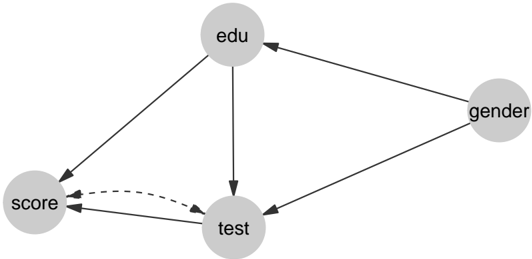
The image is a causal diagram illustrating the relationships between education ("edu"), gender, test performance ("test"), and a general score ("score"). The diagram uses nodes (circles) to represent variables and arrows to represent causal relationships. Solid arrows indicate direct causal effects, while a dashed arrow suggests a potential feedback loop or less certain relationship.
### Components/Axes
* **Nodes:**
* edu (education) - Located at the top-center of the diagram.
* gender - Located at the top-right of the diagram.
* test - Located at the bottom-center of the diagram.
* score - Located at the bottom-left of the diagram.
* **Edges (Arrows):**
* Solid arrows indicate a direct causal effect.
* Dashed arrow indicates a potential feedback loop or less certain relationship.
### Detailed Analysis or Content Details
The diagram shows the following relationships:
* **edu -> score:** Education has a direct effect on the score.
* **edu -> test:** Education has a direct effect on the test performance.
* **gender -> edu:** Gender has a direct effect on education.
* **gender -> test:** Gender has a direct effect on test performance.
* **test -> score:** Test performance has a direct effect on the score.
* **edu -> gender:** Education has a direct effect on gender.
* **test <--> score:** There is a feedback loop or correlation between test performance and the score, indicated by the dashed arrow.
### Key Observations
* Education and gender both influence test performance.
* Education also directly influences the score.
* There is a potential feedback loop between test performance and the score.
### Interpretation
The causal diagram suggests that education and gender are important factors influencing both test performance and a general score. The diagram highlights the potential for test performance to influence the score, and vice versa, creating a feedback loop. This could indicate that the score is partially based on test results, or that performance on the test is influenced by the overall score. The diagram provides a visual representation of the hypothesized relationships between these variables, which can be used to guide further research or analysis.