## Directed Graph Diagram: Variable Relationships
### Overview
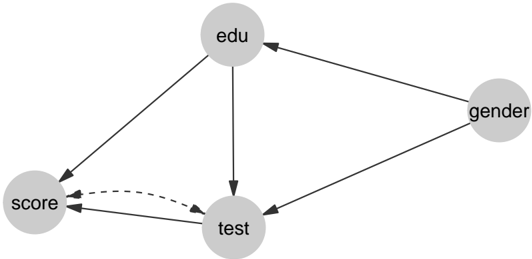
The image displays a directed graph (likely a causal or structural model) with four nodes representing variables and directed edges indicating relationships between them. The diagram is presented in grayscale on a white background.
### Components/Axes
**Nodes (Variables):**
1. **edu** (top-center): Represents education.
2. **gender** (right): Represents gender.
3. **score** (bottom-left): Represents a score (e.g., test score, performance metric).
4. **test** (bottom-center): Represents a test or testing event.
**Edges (Relationships):**
The connections are represented by arrows. The direction of the arrow indicates the direction of the proposed influence or relationship.
* A solid arrow from **edu** to **score**.
* A solid arrow from **edu** to **test**.
* A solid arrow from **gender** to **edu**.
* A solid arrow from **gender** to **test**.
* A solid arrow from **test** to **score**.
* A **dashed** arrow from **score** to **test**.
### Detailed Analysis
The graph defines a specific structure of hypothesized relationships:
1. **Exogenous Variables:** `gender` appears to be an exogenous variable, as it has only outgoing arrows (to `edu` and `test`) and no incoming arrows.
2. **Mediating Variable:** `edu` is influenced by `gender` and, in turn, influences both `test` and `score`. It acts as a mediator.
3. **Endogenous Variables:** Both `test` and `score` are endogenous, receiving influences from other variables.
4. **Reciprocal Relationship:** There is a bidirectional relationship between `test` and `score`. A solid arrow points from `test` to `score`, and a dashed arrow points back from `score` to `test`. The dashed line may indicate a feedback loop, a secondary relationship, or a correlation that is not the primary causal path being modeled.
### Key Observations
* The diagram is a classic path model or directed acyclic graph (DAG) with one noted exception: the dashed line from `score` to `test` creates a cycle, making the overall graph cyclic.
* The variable `score` is the ultimate endpoint for two direct paths: one from `edu` and one from `test`.
* The variable `test` is influenced by three sources: `edu`, `gender`, and (via the dashed feedback) `score`.
### Interpretation
This diagram represents a theoretical model, common in statistics, social sciences, or machine learning (e.g., structural equation modeling or causal inference), illustrating hypothesized causal relationships between variables.
* **Proposed Causal Structure:** The model suggests that `gender` influences both a person's `education` level and their `test` outcomes. `Education` then directly influences both the `test` and the final `score`. The `test` itself has a direct effect on the `score`.
* **The Feedback Loop:** The dashed arrow from `score` back to `test` is the most notable feature. It complicates the model by introducing a cycle. This could represent:
* A **methodological feedback**, where the score obtained influences subsequent testing (e.g., through practice effects or motivation).
* An acknowledgment of **simultaneity or reverse causality** that the primary model (solid lines) does not capture.
* A **correlation** that is not strictly causal but is important to note.
* **Overall Implication:** The model posits that the final `score` is determined by a combination of a person's background (`gender` via `edu` and direct `test` influence), their education, and their performance on a specific test, with the test and score potentially influencing each other. To validate this model, one would need data and statistical techniques capable of handling cyclic relationships or would need to reformulate the dashed connection as a correlation within a non-recursive model.