## Chart: Compute Scaling
### Overview
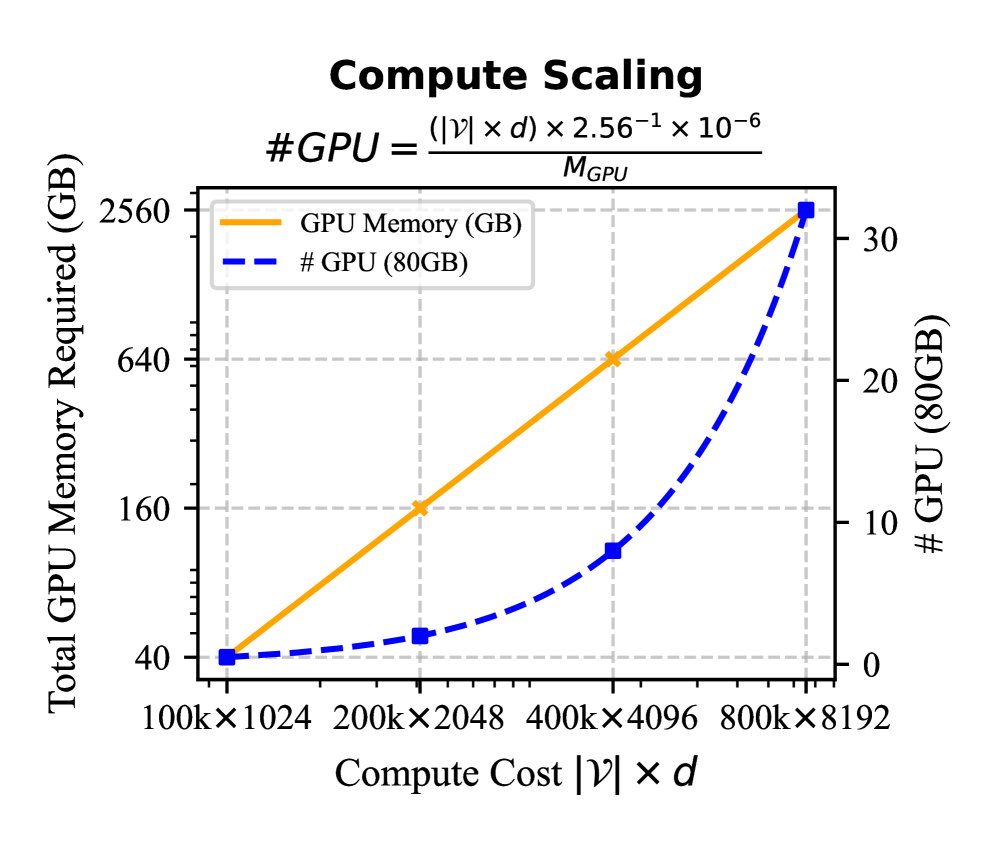
The image is a chart illustrating the compute scaling relationship between compute cost (|V| x d), total GPU memory required (GB), and the number of GPUs (80GB). The chart presents two data series: GPU Memory (GB) and # GPU (80GB), plotted against the compute cost.
### Components/Axes
* **Title:** Compute Scaling
* **Formula:** #GPU = ((|V| x d) x 2.56^-1 x 10^-6) / M\_GPU
* **X-axis:** Compute Cost |V| x d
* Scale: 100k x 1024, 200k x 2048, 400k x 4096, 800k x 8192
* **Left Y-axis:** Total GPU Memory Required (GB)
* Scale: 40, 160, 640, 2560
* **Right Y-axis:** # GPU (80GB)
* Scale: 0, 10, 20, 30
* **Legend:** Located in the top-left corner of the chart.
* Orange Line: GPU Memory (GB)
* Blue Dashed Line: # GPU (80GB)
### Detailed Analysis
* **GPU Memory (GB) - Orange Line:** The GPU Memory (GB) series exhibits a linear, upward trend.
* At Compute Cost 100k x 1024, GPU Memory is approximately 40 GB.
* At Compute Cost 200k x 2048, GPU Memory is approximately 160 GB.
* At Compute Cost 400k x 4096, GPU Memory is approximately 640 GB.
* At Compute Cost 800k x 8192, GPU Memory is approximately 2560 GB.
* **# GPU (80GB) - Blue Dashed Line:** The # GPU (80GB) series exhibits an exponential, upward trend.
* At Compute Cost 100k x 1024, # GPU is approximately 1.
* At Compute Cost 200k x 2048, # GPU is approximately 3.
* At Compute Cost 400k x 4096, # GPU is approximately 9.
* At Compute Cost 800k x 8192, # GPU is approximately 32.
### Key Observations
* The GPU Memory (GB) increases linearly with the Compute Cost.
* The # GPU (80GB) increases exponentially with the Compute Cost.
* The formula at the top of the chart defines the relationship between the number of GPUs, compute cost, and a constant factor.
### Interpretation
The chart demonstrates the scaling requirements for GPU memory and the number of GPUs as the compute cost increases. The linear increase in GPU memory suggests a direct proportionality, while the exponential increase in the number of GPUs indicates a more complex relationship, possibly due to parallelization or other architectural considerations. The formula provided gives the exact relationship between the variables. The chart is useful for estimating the hardware resources needed for different compute costs.