## Chart: Compute Scaling
### Overview
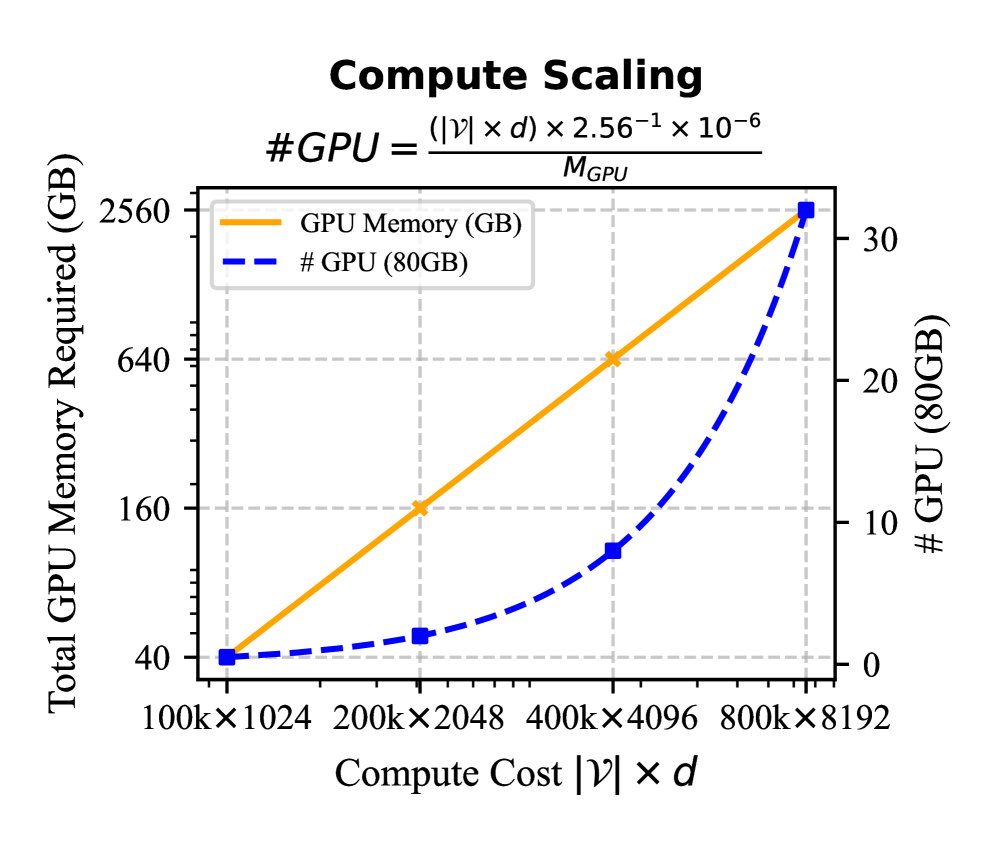
The image presents a chart illustrating the relationship between compute cost, total GPU memory required, and the number of 80GB GPUs needed. The chart uses two y-axes, one for GPU memory in Gigabytes (GB) and another for the number of GPUs. The x-axis represents the compute cost, expressed as |V| x d, where V and d are likely variables related to the computation.
### Components/Axes
* **Title:** "Compute Scaling"
* **Equation:** #GPU = (|V| x d) x 2.56⁻¹ x 10⁻⁶ / M<sub>GPU</sub>
* **X-axis Label:** "Compute Cost |V| x d"
* X-axis Markers: 100k x 1024, 200k x 2048, 400k x 4096, 800k x 8192
* **Left Y-axis Label:** "Total GPU Memory Required (GB)"
* Y-axis Markers (Left): 40, 160, 640, 2560
* **Right Y-axis Label:** "# GPU (80GB)"
* Y-axis Markers (Right): 0, 10, 20, 30
* **Legend:**
* Orange Solid Line: "GPU Memory (GB)"
* Blue Dashed Line: "# GPU (80GB)"
* **Gridlines:** Present, aiding in value estimation.
### Detailed Analysis
The chart displays two lines representing different metrics against the compute cost.
**GPU Memory (GB) - Orange Solid Line:**
The orange line exhibits a strong positive linear trend.
* At 100k x 1024 compute cost, the GPU memory required is approximately 40 GB.
* At 200k x 2048 compute cost, the GPU memory required is approximately 80 GB.
* At 400k x 4096 compute cost, the GPU memory required is approximately 160 GB.
* At 800k x 8192 compute cost, the GPU memory required is approximately 320 GB.
**# GPU (80GB) - Blue Dashed Line:**
The blue dashed line also shows a positive trend, but it is not linear. It appears to be increasing at an accelerating rate.
* At 100k x 1024 compute cost, the number of GPUs required is approximately 2.
* At 200k x 2048 compute cost, the number of GPUs required is approximately 4.
* At 400k x 4096 compute cost, the number of GPUs required is approximately 8.
* At 800k x 8192 compute cost, the number of GPUs required is approximately 30.
### Key Observations
* The GPU memory requirement scales linearly with compute cost.
* The number of GPUs required increases with compute cost, but at a non-linear rate. This suggests that as the compute cost increases, more GPUs are needed to handle the workload, and the increase in GPU count is more pronounced at higher compute costs.
* The equation provided suggests an inverse relationship between the number of GPUs and the memory capacity per GPU (M<sub>GPU</sub>).
### Interpretation
The chart demonstrates the scaling behavior of compute resources (GPU memory and number of GPUs) with increasing computational demands. The linear relationship between GPU memory and compute cost indicates that the memory requirement grows proportionally to the problem size. The non-linear relationship between the number of GPUs and compute cost suggests diminishing returns or increasing overhead as more GPUs are added.
The equation provided formalizes this relationship, showing that the number of GPUs needed is directly proportional to the compute cost and inversely proportional to the memory capacity of each GPU. This implies that using GPUs with larger memory capacities can reduce the number of GPUs required for a given compute cost, potentially leading to cost savings and improved efficiency.
The chart is useful for capacity planning and resource allocation in scenarios involving large-scale computations. It helps determine the appropriate amount of GPU memory and the number of GPUs needed to meet specific performance requirements. The data suggests that for very large compute costs (e.g., 800k x 8192), a significant number of GPUs (approximately 30) may be required, highlighting the need for scalable infrastructure.