## Bar Chart: Accuracy Improvement Comparison Between DreamPRM and PRM w/o Data Selection
### Overview
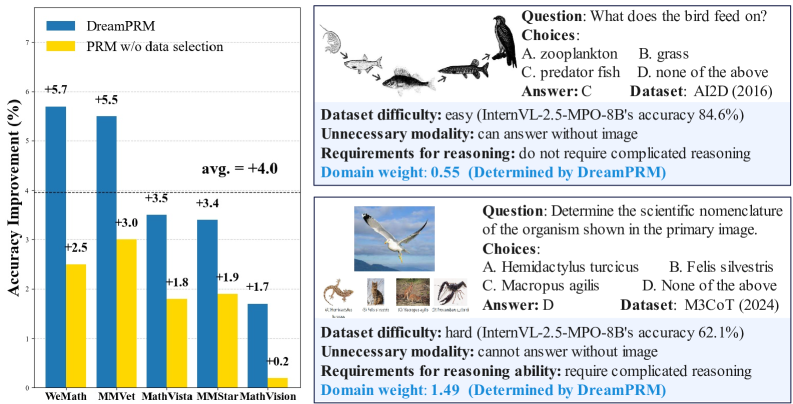
The image contains a bar chart comparing accuracy improvements between two methods (DreamPRM and PRM without data selection) across five datasets. Two text boxes on the right provide contextual examples of reasoning tasks with associated metadata.
### Components/Axes
- **X-axis (Datasets)**: WeMath, MMVet, MathVista, MMStar, MathVision
- **Y-axis (Accuracy Improvement)**: Percentage (%) from 0% to 7%
- **Legend**:
- Blue: DreamPRM
- Yellow: PRM w/o data selection
- **Additional Elements**:
- Horizontal dashed line at 4.0% (average improvement)
- Text boxes with reasoning task examples
### Detailed Analysis
#### Bar Chart Data
| Dataset | DreamPRM (%) | PRM w/o data selection (%) |
|--------------|--------------|----------------------------|
| WeMath | 5.7 | 2.5 |
| MMVet | 5.5 | 3.0 |
| MathVista | 3.5 | 1.8 |
| MMStar | 3.4 | 1.9 |
| MathVision | 1.7 | 0.2 |
#### Text Box Content
**Example 1 (AID2D 2016):**
- **Question**: What does the bird feed on?
- **Choices**: A. zooplankton, B. grass, C. predator fish, D. none
- **Answer**: C
- **Dataset Difficulty**: easy (InternVL-2.5-MPO-8B's accuracy 84.6%)
- **Unnecessary modality**: can answer without image
- **Requirements for reasoning**: do not require complicated reasoning
- **Domain weight**: 0.55 (Determined by DreamPRM)
**Example 2 (M3CoT 2024):**
- **Question**: Determine the scientific nomenclature of the organism shown.
- **Choices**: A. Hemidactylus turcicus, B. Felis silvestris, C. Macropus agilis, D. None
- **Answer**: D
- **Dataset Difficulty**: hard (InternVL-2.5-MPO-8B's accuracy 62.1%)
- **Unnecessary modality**: cannot answer without image
- **Requirements for reasoning**: require complicated reasoning
- **Domain weight**: 1.49 (Determined by DreamPRM)
### Key Observations
1. **Consistent Outperformance**: DreamPRM shows higher accuracy improvements across all datasets compared to PRM without data selection.
2. **Average Improvement**: The overall average improvement is 4.0%, with individual dataset improvements ranging from +0.2% (MathVision) to +5.7% (WeMath).
3. **Domain Weight Correlation**: Higher domain weights (e.g., 1.49 for MathVision) correspond to tasks requiring more complex reasoning and lower baseline accuracy.
4. **Modality Impact**: Tasks labeled "can answer without image" (e.g., AID2D) show higher baseline accuracy (84.6%) than image-dependent tasks (e.g., M3CoT at 62.1%).
### Interpretation
The data demonstrates that **data selection in DreamPRM significantly enhances reasoning accuracy** across diverse datasets. The domain weight metric (determined by DreamPRM) quantifies task complexity, with higher weights indicating greater reasoning demands. For instance:
- **MathVision** (domain weight 1.49) requires complex reasoning and shows minimal improvement (+0.2%), suggesting inherent difficulty.
- **WeMath** (domain weight 0.55) benefits most from data selection (+5.7%), highlighting the method's effectiveness for simpler tasks.
- The **average 4.0% improvement** underscores the systematic advantage of DreamPRM, particularly in image-dependent tasks where baseline accuracy is lower.
This analysis reveals that **domain-specific data curation** (via DreamPRM) is critical for optimizing performance in reasoning tasks with varying complexity and modality requirements.