## Line Chart: Model Performance vs. Training and Inference Scales
### Overview
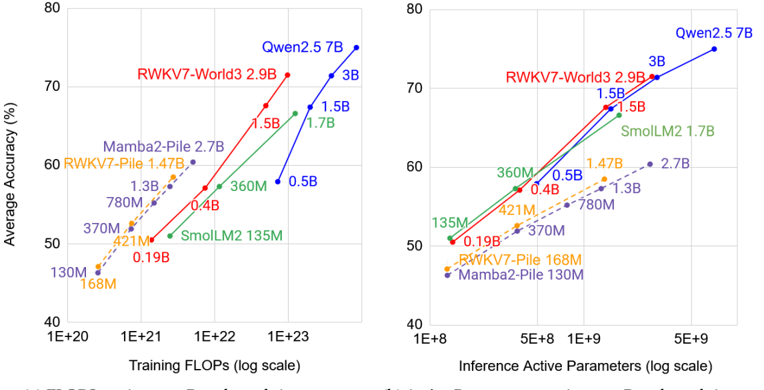
The image contains two side-by-side line charts comparing the average accuracy of different language models (LMs) as a function of **Training FLOPs** (left panel) and **Inference Active Parameters** (right panel). Both panels use a logarithmic scale for their x-axes and a linear scale for the y-axis (Average Accuracy in %). The charts highlight trade-offs between model size, computational resources, and performance.
---
### Components/Axes
#### Left Panel: Training FLOPs (log scale)
- **X-axis**: Training FLOPs (log scale), labeled with markers at `1E+20`, `1E+21`, `1E+22`, `1E+23`.
- **Y-axis**: Average Accuracy (%), ranging from 40% to 80%.
- **Legend**: Located on the right, with color-coded lines for:
- **Blue**: Qwen2.5 7B
- **Red**: RWKV7-World3 2.9B
- **Green**: SmolLM2 1.7B
- **Orange**: RWKV7-Pile 1.47B
- **Purple**: Mamba2-Pile 1.3B
#### Right Panel: Inference Active Parameters (log scale)
- **X-axis**: Inference Active Parameters (log scale), labeled with markers at `1E+8`, `5E+8`, `1E+9`, `5E+9`.
- **Y-axis**: Average Accuracy (%), same range as the left panel.
- **Legend**: Same as the left panel, with identical color coding.
---
### Detailed Analysis
#### Left Panel: Training FLOPs
- **Qwen2.5 7B (Blue)**:
- Starts at ~50% accuracy at `1E+20` FLOPs, rising to ~75% at `1E+23`.
- **Trend**: Steep upward slope, indicating strong scaling with training compute.
- **RWKV7-World3 2.9B (Red)**:
- Begins at ~50% at `1E+20`, reaching ~70% at `1E+23`.
- **Trend**: Slightly less steep than Qwen2.5 but still shows strong scaling.
- **SmolLM2 1.7B (Green)**:
- Starts at ~50% at `1E+20`, peaking at ~65% at `1E+22`, then plateaus.
- **Trend**: Limited scaling beyond `1E+22` FLOPs.
- **RWKV7-Pile 1.47B (Orange)**:
- Starts at ~50% at `1E+20`, reaching ~60% at `1E+22`.
- **Trend**: Moderate scaling, plateauing earlier than larger models.
- **Mamba2-Pile 1.3B (Purple)**:
- Starts at ~50% at `1E+20`, peaking at ~55% at `1E+22`.
- **Trend**: Minimal scaling, suggesting inefficiency in training.
#### Right Panel: Inference Active Parameters
- **Qwen2.5 7B (Blue)**:
- Starts at ~50% at `1E+8` parameters, rising to ~75% at `5E+9`.
- **Trend**: Strong scaling with parameter count.
- **RWKV7-World3 2.9B (Red)**:
- Begins at ~50% at `1E+8`, reaching ~70% at `5E+9`.
- **Trend**: Similar to Qwen2.5 but slightly less efficient.
- **SmolLM2 1.7B (Green)**:
- Starts at ~50% at `1E+8`, peaking at ~65% at `1E+9`, then plateaus.
- **Trend**: Limited scaling beyond `1E+9` parameters.
- **RWKV7-Pile 1.47B (Orange)**:
- Starts at ~50% at `1E+8`, reaching ~60% at `1E+9`.
- **Trend**: Moderate scaling, plateauing earlier.
- **Mamba2-Pile 1.3B (Purple)**:
- Starts at ~50% at `1E+8`, peaking at ~55% at `1E+9`.
- **Trend**: Minimal scaling, similar to left panel.
---
### Key Observations
1. **Model Size vs. Performance**:
- Larger models (e.g., Qwen2.5 7B, RWKV7-World3 2.9B) achieve higher accuracy with more training FLOPs and inference parameters.
- Smaller models (e.g., Mamba2-Pile 1.3B) show limited scaling, suggesting architectural or training inefficiencies.
2. **Training vs. Inference Trade-offs**:
- Models with higher training FLOPs (e.g., Qwen2.5 7B) also require more inference parameters but achieve better accuracy.
- Smaller models (e.g., SmolLM2 1.7B) achieve decent accuracy with fewer resources but plateau earlier.
3. **Outliers**:
- **Mamba2-Pile 1.3B** consistently underperforms despite similar training/inference scales to RWKV7-Pile 1.47B, indicating potential architectural limitations.
---
### Interpretation
The charts demonstrate a clear correlation between **model size**, **training compute (FLOPs)**, and **inference efficiency**. Larger models like Qwen2.5 7B and RWKV7-World3 2.9B outperform smaller models in both training and inference, but at the cost of higher resource demands. Smaller models (e.g., SmolLM2 1.7B) offer a trade-off between performance and efficiency, suitable for resource-constrained scenarios. The plateauing trends for smaller models suggest diminishing returns beyond certain scales, highlighting the need for architectural innovations to improve scalability. The discrepancy in the left panel’s x-axis labels (e.g., `1E+20` vs. data points at `130M`) may indicate a mislabeling error, but the relative trends remain consistent.