\n
## Diagram: Scene Graph Analysis - Professional vs. Family
### Overview
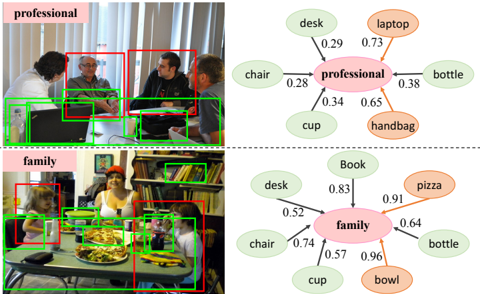
The image presents a comparison of scene graph analyses for two distinct scenarios: "professional" and "family". Each scenario is represented by a photograph on the left and a corresponding scene graph on the right. The photographs show people in different settings, with bounding boxes highlighting detected objects. The scene graphs depict the relationships between these objects and the central theme (professional or family) using nodes and weighted edges.
### Components/Axes
The image is divided into two rows, each representing a scenario. Each row contains:
* **Photograph:** A color image depicting a scene. Bounding boxes in red, green, and black highlight detected objects.
* **Scene Graph:** A network diagram with nodes representing objects and edges representing relationships. The central node is labeled "professional" or "family" in a pink oval. Edge weights are numerical values between 0 and 1.
The scene graphs include the following nodes:
* **Professional:** desk, laptop, chair, cup, bottle, handbag
* **Family:** desk, book, chair, cup, bowl, pizza, bottle
### Detailed Analysis or Content Details
**Professional Scenario (Top Row)**
* **Photograph:** Shows three people seated around a table. Red boxes highlight faces, green boxes highlight laptops, and a black box highlights a bottle. The image is labeled "professional" in the top-left corner.
* **Scene Graph:** The central node is "professional".
* "professional" - "desk": 0.29
* "professional" - "laptop": 0.73
* "professional" - "chair": 0.28
* "professional" - "cup": 0.34
* "professional" - "bottle": 0.38
* "professional" - "handbag": 0.65
**Family Scenario (Bottom Row)**
* **Photograph:** Shows a family gathered around a table with food. Red boxes highlight faces, green boxes highlight food items (pizza, etc.), and black boxes highlight other objects. The image is labeled "family" in the top-left corner.
* **Scene Graph:** The central node is "family".
* "family" - "desk": 0.52
* "family" - "book": 0.83
* "family" - "chair": 0.74
* "family" - "cup": 0.57
* "family" - "bowl": 0.96
* "family" - "pizza": 0.91
* "family" - "bottle": 0.64
### Key Observations
* The edge weights in the "family" scene graph are generally higher than those in the "professional" scene graph, suggesting stronger relationships between objects in the family setting.
* The "laptop" has a relatively high weight (0.73) in the "professional" graph, indicating a strong association with professional settings.
* "pizza", "bowl", and "book" have high weights (0.91, 0.96, 0.83 respectively) in the "family" graph, suggesting these objects are strongly associated with family settings.
* "chair", "cup", "bottle", and "desk" appear in both graphs, but with different weights, indicating their relevance varies depending on the context.
### Interpretation
The diagrams demonstrate how scene graph analysis can be used to characterize different scenarios based on the objects present and their relationships. The weights on the edges represent the strength of association between the central theme ("professional" or "family") and the detected objects. The higher weights in the "family" graph suggest a more cohesive and strongly defined scene, while the "professional" scene appears more loosely connected.
The differences in object associations highlight the typical elements of each scenario. Laptops are strongly linked to professional settings, while food items like pizza and bowls are strongly linked to family settings. This type of analysis could be used for automated scene understanding, image retrieval, or activity recognition. The bounding boxes in the photographs indicate the objects that were detected and used to construct the scene graphs. The analysis suggests that the system is able to identify and relate objects to broader contextual themes.